EA review - Bear Vs Bull
| Rating total: | |
| Backtests: | |
| Live performance: | |
| Risk control: | |
| Customizability: | |
| Price: |
| Vendor link | Price: | $199 (2022.11.20) |
| Trading strategy: | Trend, S/R levels |
| Vendor live account: | Yes |
| Own live account: | No |
| Latest tested version: | 4.2 |
| Latest tested date: | 2019.08.24 |
| Risk factors: | Slow execution of pending orders |
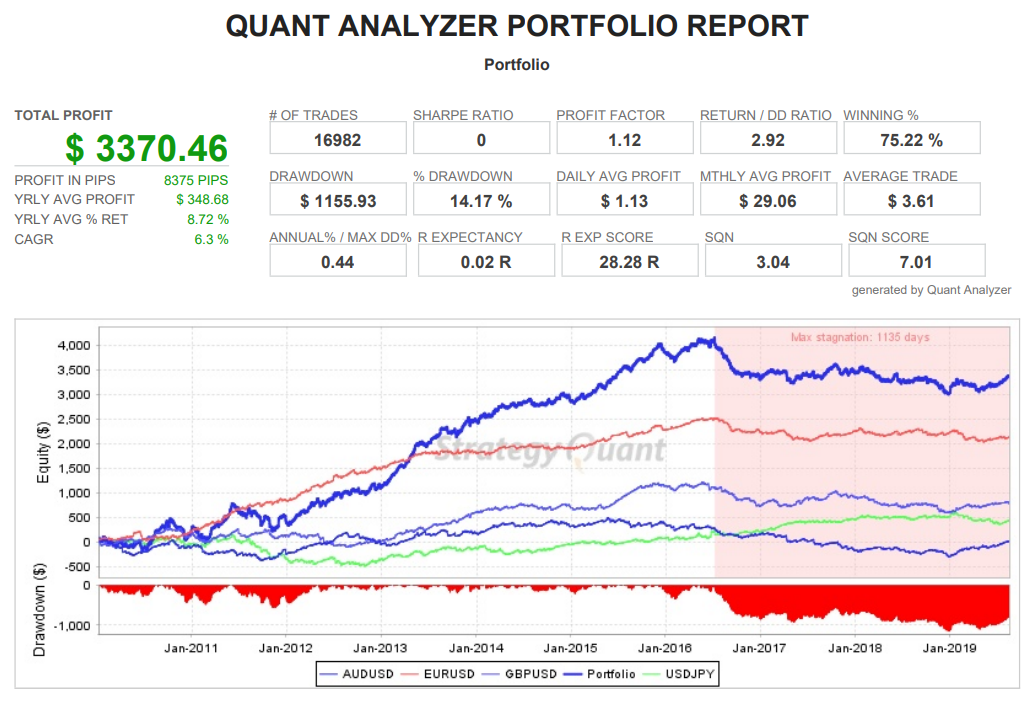
Bear Vs Bull is a breakout scalper that trades around the support and resistances levels on a relatively high time frame (H4). It uses pending stop orders at the entry levels and is desiged to trade GBPUSD, EURUSD, AUDUSD and USDJPY.
Our opinion
Interestingly, this is a rare case where the impressive live account performance is actually better than the backtests with real spread and execution delay. Possible reasons could be a better spread compared to the Dukascopy backtest data and better execution. However, since the live account only uses micro lots it is hard to judge whether such a strategy will also work on larger lot sizes. For the low price of the EA it might be worth a try.Live performance
Fixed lot size backtests
Why do we use fixed lot size (0.1 lots)? Check our educational page.
Dukascopy 2019.08.24, version 4.2| Symbol | EURUSD (Euro vs US Dollar) | ||||
| Period | 4 Hours (H4) 2010.01.01 00:00 - 2019.08.16 20:00 (2010.01.01 - 2019.08.31) | ||||
| Model | Every tick (the most precise method based on all available least timeframes) | ||||
| Parameters | comment="Bear Vs Bull"; mm=1; RiskPerTrade_percent=0.5; order_amount_lots=0.1; MagicNumber=171819787; slippage=15; MondayStartTime="01:00"; FridayCloseTime="22:00"; allowHedgeTrades=true; MaxSpreadPoints=12; stoploss_points=300; takeprofit_points=1000; use_breakeven=false; breakeven_threshold_points=1000; breakeven_addition_points=0; useTrailingStop=true; trailingStop_threshold=30; trailingStop_trail=30; | ||||
| Bars in test | 17024 | Ticks modelled | 227659403 | Modelling quality | 99.90% |
| Mismatched charts errors | 0 | ||||
| Initial deposit | 1000.00 | Spread | Variable | ||
| Total net profit | 2130.94 | Gross profit | 8396.67 | Gross loss | -6265.73 |
| Profit factor | 1.34 | Expected payoff | 0.89 | ||
| Absolute drawdown | 9.70 | Maximal drawdown | 506.74 (14.37%) | Relative drawdown | 16.49% (199.60) |
| Total trades | 2391 | Short positions (won %) | 1162 (78.14%) | Long positions (won %) | 1229 (77.14%) |
| Profit trades (% of total) | 1856 (77.62%) | Loss trades (% of total) | 535 (22.38%) | ||
| Largest | profit trade | 70.20 | loss trade | -45.80 | |
| Average | profit trade | 4.52 | loss trade | -11.71 | |
| Maximum | consecutive wins (profit in money) | 24 (160.80) | consecutive losses (loss in money) | 5 (-66.50) | |
| Maximal | consecutive profit (count of wins) | 160.80 (24) | consecutive loss (count of losses) | -94.10 (3) | |
| Average | consecutive wins | 4 | consecutive losses | 1 | |

| Symbol | USDJPY (US Dollar vs Japanese Yen) | ||||
| Period | 4 Hours (H4) 2010.01.04 00:00 - 2019.08.16 20:00 (2010.01.01 - 2019.08.31) | ||||
| Model | Every tick (the most precise method based on all available least timeframes) | ||||
| Parameters | comment="Bear Vs Bull"; mm=1; RiskPerTrade_percent=0.5; order_amount_lots=0.1; MagicNumber=171819787; slippage=15; MondayStartTime="01:00"; FridayCloseTime="22:00"; allowHedgeTrades=true; MaxSpreadPoints=12; stoploss_points=300; takeprofit_points=1000; use_breakeven=false; breakeven_threshold_points=1000; breakeven_addition_points=0; useTrailingStop=true; trailingStop_threshold=30; trailingStop_trail=30; | ||||
| Bars in test | 17012 | Ticks modelled | 182482812 | Modelling quality | 99.90% |
| Mismatched charts errors | 0 | ||||
| Initial deposit | 1000.00 | Spread | Variable | ||
| Total net profit | 433.75 | Gross profit | 7332.01 | Gross loss | -6898.26 |
| Profit factor | 1.06 | Expected payoff | 0.19 | ||
| Absolute drawdown | 500.97 | Maximal drawdown | 650.20 (56.58%) | Relative drawdown | 56.58% (650.20) |
| Total trades | 2279 | Short positions (won %) | 1099 (74.16%) | Long positions (won %) | 1180 (77.63%) |
| Profit trades (% of total) | 1731 (75.95%) | Loss trades (% of total) | 548 (24.05%) | ||
| Largest | profit trade | 68.31 | loss trade | -72.99 | |
| Average | profit trade | 4.24 | loss trade | -12.59 | |
| Maximum | consecutive wins (profit in money) | 31 (121.41) | consecutive losses (loss in money) | 4 (-125.25) | |
| Maximal | consecutive profit (count of wins) | 123.39 (6) | consecutive loss (count of losses) | -125.25 (4) | |
| Average | consecutive wins | 4 | consecutive losses | 1 | |

| Symbol | GBPUSD (Great Britain Pound vs US Dollar) | ||||
| Period | 4 Hours (H4) 2010.01.01 00:00 - 2019.08.16 20:00 (2010.01.01 - 2019.08.31) | ||||
| Model | Every tick (the most precise method based on all available least timeframes) | ||||
| Parameters | comment="Bear Vs Bull"; mm=1; RiskPerTrade_percent=0.5; order_amount_lots=0.1; MagicNumber=171819787; slippage=15; MondayStartTime="01:00"; FridayCloseTime="22:00"; allowHedgeTrades=true; MaxSpreadPoints=12; stoploss_points=300; takeprofit_points=1000; use_breakeven=false; breakeven_threshold_points=1000; breakeven_addition_points=0; useTrailingStop=true; trailingStop_threshold=30; trailingStop_trail=30; | ||||
| Bars in test | 17022 | Ticks modelled | 224053240 | Modelling quality | 99.90% |
| Mismatched charts errors | 0 | ||||
| Initial deposit | 1000.00 | Spread | Variable | ||
| Total net profit | 794.13 | Gross profit | 8922.21 | Gross loss | -8128.08 |
| Profit factor | 1.10 | Expected payoff | 0.33 | ||
| Absolute drawdown | 131.42 | Maximal drawdown | 652.52 (29.41%) | Relative drawdown | 32.86% (425.12) |
| Total trades | 2383 | Short positions (won %) | 1183 (76.50%) | Long positions (won %) | 1200 (78.33%) |
| Profit trades (% of total) | 1845 (77.42%) | Loss trades (% of total) | 538 (22.58%) | ||
| Largest | profit trade | 41.90 | loss trade | -48.20 | |
| Average | profit trade | 4.84 | loss trade | -15.11 | |
| Maximum | consecutive wins (profit in money) | 31 (112.58) | consecutive losses (loss in money) | 6 (-127.00) | |
| Maximal | consecutive profit (count of wins) | 124.90 (23) | consecutive loss (count of losses) | -127.00 (6) | |
| Average | consecutive wins | 4 | consecutive losses | 1 | |

| Symbol | AUDUSD (Australian Dollar vs US Dollar) | ||||
| Period | 4 Hours (H4) 2010.01.01 00:00 - 2019.08.16 20:00 (2010.01.01 - 2019.08.31) | ||||
| Model | Every tick (the most precise method based on all available least timeframes) | ||||
| Parameters | comment="Bear Vs Bull"; mm=1; RiskPerTrade_percent=0.5; order_amount_lots=0.1; MagicNumber=171819787; slippage=15; MondayStartTime="01:00"; FridayCloseTime="22:00"; allowHedgeTrades=true; MaxSpreadPoints=12; stoploss_points=300; takeprofit_points=1000; use_breakeven=false; breakeven_threshold_points=1000; breakeven_addition_points=0; useTrailingStop=true; trailingStop_threshold=30; trailingStop_trail=30; | ||||
| Bars in test | 17038 | Ticks modelled | 179663008 | Modelling quality | 99.90% |
| Mismatched charts errors | 0 | ||||
| Initial deposit | 1000.00 | Spread | Variable | ||
| Total net profit | 11.52 | Gross profit | 7669.73 | Gross loss | -7658.21 |
| Profit factor | 1.00 | Expected payoff | 0.00 | ||
| Absolute drawdown | 395.08 | Maximal drawdown | 821.62 (54.98%) | Relative drawdown | 54.98% (821.62) |
| Total trades | 2421 | Short positions (won %) | 1166 (76.67%) | Long positions (won %) | 1255 (75.22%) |
| Profit trades (% of total) | 1838 (75.92%) | Loss trades (% of total) | 583 (24.08%) | ||
| Largest | profit trade | 55.50 | loss trade | -52.30 | |
| Average | profit trade | 4.17 | loss trade | -13.14 | |
| Maximum | consecutive wins (profit in money) | 24 (117.60) | consecutive losses (loss in money) | 5 (-114.50) | |
| Maximal | consecutive profit (count of wins) | 117.60 (24) | consecutive loss (count of losses) | -114.50 (5) | |
| Average | consecutive wins | 4 | consecutive losses | 1 | |

All EA reviews (15)
Latest EA reviews
AutoGenEA
An EA that is developed by Generic Machine Learning. Check it out
Momentum EA BOA
A momentum / trend following strategy with good and stable backtests.
Scalperinho EA
A very promissing EA that trades intraday pullbacks on a impressive number of 28 pairs.
StarX
A cheap night scalper with promising backtests. Check it out.
Inertia EA Extra
A S/R scalper for the EURUSD pair with an impressive backtest.
SFE Night Scalper
An asian scalper with a 4 years old live account. Check out our review
Aura MT4
A trend follwing system with inconsistent backtests.
SFE Stealth
Promising new Asian scalper with good live results. Check out our review.
FXStabilizer PRO
A martingale system which survived astonishing long in live trading
Mito EA
A trend / counter trend system that trades 31 different pairs. Check it out
FXAdept
A successful trend following EA with nearly two years of live history. Check out our review.
Bazava
A quite cheap intraday scalper for the NZDUSD. Is it worth the money? Check it out.
Tesseract
A counter-trend system with inconsistent backtests
Legend
A combination of a momentum based strategy and an SR level breakout system
CEF Phantom Scalper
An aggressive intraday counter-trend scalper on M1 time frame
Want to start trading on a live or demo account?
Be aware that most retail traders (usually around 60-80%) lose money. Please consider whether you can afford to take the risk of losing your money.