EA review - MiriumInvestSoft EA
| Rating total: | |
| Backtests: | |
| Live performance: | |
| Risk control: | |
| Customizability: | |
| Price: |
| Vendor link | Price: | $2000 (2019.09.23) |
| Trading strategy: | Counter-Trend, Night Scalper, Grid |
| Vendor live account: | No |
| Own live account: | No |
| Latest tested version: | 2.0 |
| Latest tested date: | 2019.09.03 |
| Risk factors: | Breaking news, flash crashes and other strong price movements |
This EA has been removed from the market. If you are still interested, you could try to contact the seller directly via his profile.
MiriumInvestSoft EA combines a mean reversion strategy during the quite trading hours of the day with a small grid system. It usually opens the first position around the rollover time.
To increase the probability of a profitable exit, the EA uses a small grid with up to 4 positions if the price moves against the initial position. While it increases the win percentage, it also increases the possible maximum loss in case the price moves further against the position. The SL of all grid positions is not the same and the few times where it did not end profitably in backtests, the EA opened new positions each time an old ones hit the SL until the new grid eventually ended up in profit (excluding the losses from earlier positions). So it is not clear whether this trading logic would continue forever in case of a very strong price movement, which could be potentially risky.
The seller does not offer a singal on a real account, but there is a demo signal available. The positions are usually opened exactly at rollover time (00:00 in GMT+2/+3 time zone), which might not work that well on real accounts as many brokers close the market for a few minutes or have extreme spreads.
Since the list of recommended pairs is very short (EURUSD, USDJPY), we also tested other major pairs. The backtests did not look good. While there might be strategies that only work on very few pairs, this can often also be a sign for over-optimization. However, we noticed that the grid logic did not seem to work on those pairs, so it might just be that only a part of the trading logic is used on non-recommended pairs and therefore the backtests should not be taken too much into account.
Our opinion
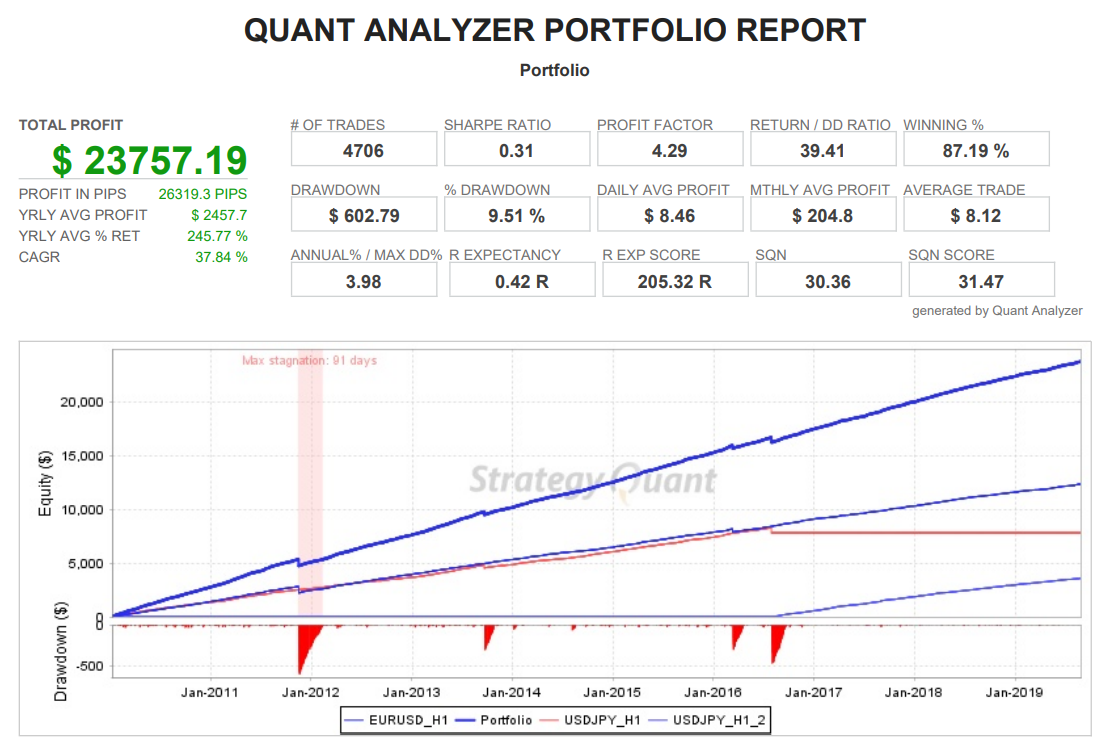
The backtests equity curves for the recommended pairs, EURUSD and USDJPY, look amazing. However, for USDJPY there was an error on 2016.07.29, which forced us to do two separated backtests for the periods before and afterwards. The backtests should be error free before we recommend to buy an EA. In addition, we strongly recommend buying only EAs where the seller transparently demonstrates the performance on a live account (not just demo).Fixed lot size backtests
Why do we use fixed lot size (0.1 lots)? Check our educational page.
Dukascopy 2019.09.03, version 2.0| Symbol | EURUSD (Euro vs US Dollar) | ||||
| Period | 1 Hour (H1) 2010.01.01 02:00 - 2019.08.27 09:00 (2010.01.01 - 2019.08.31) | ||||
| Model | Every tick (the most precise method based on all available least timeframes) | ||||
| Parameters | orders_comment="MiriumInvestSoft EA"; Magic1=111; Magic2=11111; max_spread=3; Slippage=1; Lots_A=0; Lots=0.1; Risk=1; | ||||
| Bars in test | 62272 | Ticks modelled | 228354381 | Modelling quality | 99.90% |
| Mismatched charts errors | 0 | ||||
| Initial deposit | 1000.00 | Spread | Variable | ||
| Total net profit | 12346.42 | Gross profit | 16215.42 | Gross loss | -3869.00 |
| Profit factor | 4.19 | Expected payoff | 5.00 | ||
| Absolute drawdown | 3.50 | Maximal drawdown | 760.20 (19.89%) | Relative drawdown | 19.89% (760.20) |
| Total trades | 2468 | Short positions (won %) | 1234 (91.82%) | Long positions (won %) | 1234 (82.98%) |
| Profit trades (% of total) | 2157 (87.40%) | Loss trades (% of total) | 311 (12.60%) | ||
| Largest | profit trade | 64.90 | loss trade | -150.70 | |
| Average | profit trade | 7.52 | loss trade | -12.44 | |
| Maximum | consecutive wins (profit in money) | 61 (354.70) | consecutive losses (loss in money) | 5 (-609.80) | |
| Maximal | consecutive profit (count of wins) | 354.70 (61) | consecutive loss (count of losses) | -609.80 (5) | |
| Average | consecutive wins | 8 | consecutive losses | 1 | |

| Symbol | USDJPY (US Dollar vs Japanese Yen) | ||||
| Period | 1 Hour (H1) 2010.01.04 00:00 - 2019.08.27 10:00 (2010.01.01 - 2019.08.31) | ||||
| Model | Every tick (the most precise method based on all available least timeframes) | ||||
| Parameters | orders_comment="MiriumInvestSoft EA"; Magic1=111; Magic2=11111; max_spread=3; Slippage=1; Lots_A=0; Lots=0.1; Risk=1; | ||||
| Bars in test | 62224 | Ticks modelled | 183220825 | Modelling quality | 99.90% |
| Mismatched charts errors | 0 | ||||
| Initial deposit | 1000.00 | Spread | Variable | ||
| Total net profit | 7824.42 | Gross profit | 10717.38 | Gross loss | -2892.96 |
| Profit factor | 3.70 | Expected payoff | 5.00 | ||
| Absolute drawdown | 17.06 | Maximal drawdown | 587.52 (10.04%) | Relative drawdown | 16.35% (337.60) |
| Total trades | 1564 | Short positions (won %) | 809 (87.89%) | Long positions (won %) | 755 (85.43%) |
| Profit trades (% of total) | 1356 (86.70%) | Loss trades (% of total) | 208 (13.30%) | ||
| Largest | profit trade | 65.51 | loss trade | -151.26 | |
| Average | profit trade | 7.90 | loss trade | -13.91 | |
| Maximum | consecutive wins (profit in money) | 37 (231.90) | consecutive losses (loss in money) | 4 (-470.04) | |
| Maximal | consecutive profit (count of wins) | 239.64 (31) | consecutive loss (count of losses) | -470.04 (4) | |
| Average | consecutive wins | 7 | consecutive losses | 1 | |

| Symbol | USDJPY (US Dollar vs Japanese Yen) | ||||
| Period | 1 Hour (H1) 2016.07.29 03:00 - 2019.08.27 10:00 (2016.07.29 - 2019.08.31) | ||||
| Model | Every tick (the most precise method based on all available least timeframes) | ||||
| Parameters | orders_comment="MiriumInvestSoft EA"; Magic1=111; Magic2=11111; max_spread=3; Slippage=1; Lots_A=0; Lots=0.1; Risk=1; | ||||
| Bars in test | 21249 | Ticks modelled | 74043120 | Modelling quality | 99.90% |
| Mismatched charts errors | 0 | ||||
| Initial deposit | 1000.00 | Spread | Variable | ||
| Total net profit | 3586.31 | Gross profit | 4045.07 | Gross loss | -458.76 |
| Profit factor | 8.82 | Expected payoff | 5.32 | ||
| Absolute drawdown | 18.22 | Maximal drawdown | 272.08 (11.21%) | Relative drawdown | 11.21% (272.08) |
| Total trades | 674 | Short positions (won %) | 326 (97.55%) | Long positions (won %) | 348 (85.92%) |
| Profit trades (% of total) | 617 (91.54%) | Loss trades (% of total) | 57 (8.46%) | ||
| Largest | profit trade | 32.23 | loss trade | -26.30 | |
| Average | profit trade | 6.56 | loss trade | -8.05 | |
| Maximum | consecutive wins (profit in money) | 49 (259.26) | consecutive losses (loss in money) | 2 (-34.48) | |
| Maximal | consecutive profit (count of wins) | 259.26 (49) | consecutive loss (count of losses) | -34.48 (2) | |
| Average | consecutive wins | 11 | consecutive losses | 1 | |

| Symbol | GBPUSD (Great Britain Pound vs US Dollar) | ||||
| Period | 1 Hour (H1) 2010.01.01 02:00 - 2019.08.27 10:00 (2010.01.01 - 2019.08.31) | ||||
| Model | Every tick (the most precise method based on all available least timeframes) | ||||
| Parameters | orders_comment="MiriumInvestSoft EA"; Magic1=111; Magic2=11111; max_spread=3; Slippage=1; Lots_A=0; Lots=0.1; Risk=1; | ||||
| Bars in test | 62270 | Ticks modelled | 224899078 | Modelling quality | 99.90% |
| Mismatched charts errors | 0 | ||||
| Initial deposit | 1000.00 | Spread | Variable | ||
| Total net profit | 338.79 | Gross profit | 10822.33 | Gross loss | -10483.55 |
| Profit factor | 1.03 | Expected payoff | 0.16 | ||
| Absolute drawdown | 51.50 | Maximal drawdown | 2104.71 (67.71%) | Relative drawdown | 67.71% (2104.71) |
| Total trades | 2088 | Short positions (won %) | 1072 (96.92%) | Long positions (won %) | 1016 (96.06%) |
| Profit trades (% of total) | 2015 (96.50%) | Loss trades (% of total) | 73 (3.50%) | ||
| Largest | profit trade | 31.90 | loss trade | -163.00 | |
| Average | profit trade | 5.37 | loss trade | -143.61 | |
| Maximum | consecutive wins (profit in money) | 97 (522.95) | consecutive losses (loss in money) | 2 (-300.23) | |
| Maximal | consecutive profit (count of wins) | 522.95 (97) | consecutive loss (count of losses) | -300.23 (2) | |
| Average | consecutive wins | 28 | consecutive losses | 1 | |

| Symbol | USDCAD (US Dollar vs Canadian Dollar) | ||||
| Period | 1 Hour (H1) 2010.01.01 02:00 - 2019.08.27 10:00 (2010.01.01 - 2019.08.31) | ||||
| Model | Every tick (the most precise method based on all available least timeframes) | ||||
| Parameters | orders_comment="MiriumInvestSoft EA"; Magic1=111; Magic2=11111; max_spread=3; Slippage=1; Lots_A=0; Lots=0.1; Risk=1; | ||||
| Bars in test | 62268 | Ticks modelled | 176661297 | Modelling quality | 99.90% |
| Mismatched charts errors | 0 | ||||
| Initial deposit | 10000.00 | Spread | Variable | ||
| Total net profit | -1382.32 | Gross profit | 8998.61 | Gross loss | -10380.93 |
| Profit factor | 0.87 | Expected payoff | -0.78 | ||
| Absolute drawdown | 2149.37 | Maximal drawdown | 2407.99 (23.47%) | Relative drawdown | 23.47% (2407.99) |
| Total trades | 1778 | Short positions (won %) | 917 (94.77%) | Long positions (won %) | 861 (96.28%) |
| Profit trades (% of total) | 1698 (95.50%) | Loss trades (% of total) | 80 (4.50%) | ||
| Largest | profit trade | 16.86 | loss trade | -161.47 | |
| Average | profit trade | 5.30 | loss trade | -129.76 | |
| Maximum | consecutive wins (profit in money) | 79 (409.05) | consecutive losses (loss in money) | 2 (-232.75) | |
| Maximal | consecutive profit (count of wins) | 409.05 (79) | consecutive loss (count of losses) | -232.75 (2) | |
| Average | consecutive wins | 21 | consecutive losses | 1 | |

| Symbol | USDCHF (US Dollar vs Swiss Franc) | ||||
| Period | 1 Hour (H1) 2010.01.01 02:00 - 2019.08.27 10:00 (2010.01.01 - 2019.08.31) | ||||
| Model | Every tick (the most precise method based on all available least timeframes) | ||||
| Parameters | orders_comment="MiriumInvestSoft EA"; Magic1=111; Magic2=11111; max_spread=3; Slippage=1; Lots_A=0; Lots=0.1; Risk=1; | ||||
| Bars in test | 62210 | Ticks modelled | 164626753 | Modelling quality | 99.90% |
| Mismatched charts errors | 0 | ||||
| Initial deposit | 10000.00 | Spread | Variable | ||
| Total net profit | -3217.26 | Gross profit | 8846.44 | Gross loss | -12063.70 |
| Profit factor | 0.73 | Expected payoff | -1.86 | ||
| Absolute drawdown | 3389.71 | Maximal drawdown | 3902.41 (37.12%) | Relative drawdown | 37.12% (3902.41) |
| Total trades | 1727 | Short positions (won %) | 923 (94.58%) | Long positions (won %) | 804 (96.52%) |
| Profit trades (% of total) | 1649 (95.48%) | Loss trades (% of total) | 78 (4.52%) | ||
| Largest | profit trade | 37.05 | loss trade | -193.85 | |
| Average | profit trade | 5.36 | loss trade | -154.66 | |
| Maximum | consecutive wins (profit in money) | 89 (473.76) | consecutive losses (loss in money) | 4 (-657.99) | |
| Maximal | consecutive profit (count of wins) | 473.76 (89) | consecutive loss (count of losses) | -657.99 (4) | |
| Average | consecutive wins | 23 | consecutive losses | 1 | |

All EA reviews (15)
Latest EA reviews
AutoGenEA
An EA that is developed by Generic Machine Learning. Check it out
Momentum EA BOA
A momentum / trend following strategy with good and stable backtests.
Scalperinho EA
A very promissing EA that trades intraday pullbacks on a impressive number of 28 pairs.
StarX
A cheap night scalper with promising backtests. Check it out.
Inertia EA Extra
A S/R scalper for the EURUSD pair with an impressive backtest.
SFE Night Scalper
An asian scalper with a 4 years old live account. Check out our review
Aura MT4
A trend follwing system with inconsistent backtests.
SFE Stealth
Promising new Asian scalper with good live results. Check out our review.
FXStabilizer PRO
A martingale system which survived astonishing long in live trading
Mito EA
A trend / counter trend system that trades 31 different pairs. Check it out
FXAdept
A successful trend following EA with nearly two years of live history. Check out our review.
Bazava
A quite cheap intraday scalper for the NZDUSD. Is it worth the money? Check it out.
Tesseract
A counter-trend system with inconsistent backtests
Legend
A combination of a momentum based strategy and an SR level breakout system
CEF Phantom Scalper
An aggressive intraday counter-trend scalper on M1 time frame
Want to start trading on a live or demo account?
Be aware that most retail traders (usually around 60-80%) lose money. Please consider whether you can afford to take the risk of losing your money.