EA review - Aura MT4
| Rating total: | |
| Backtests: | |
| Live performance: | |
| Risk control: | |
| Customizability: | |
| Price: |
| Vendor link | Price: | $1199 (2020.02.19) |
| Trading strategy: | Trend |
| Vendor live account: | No |
| Own live account: | Yes |
| Latest tested version: | v1.0 |
| Latest tested date: | 2019.10.15 |
| Risk factors: |
This EA has been removed from the market. If you are still interested, you could try to contact the seller directly via his profile.
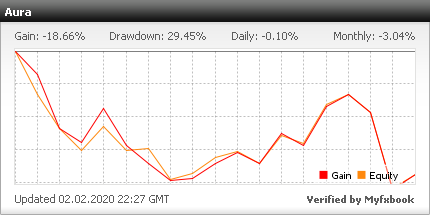
Aura MT4 is a trend strategy that seems to open a trade after a pullback in the direction to the trend.
It opens max. one trade per currency pair and every trade has a SL and TP. All positions are closed at these targets.
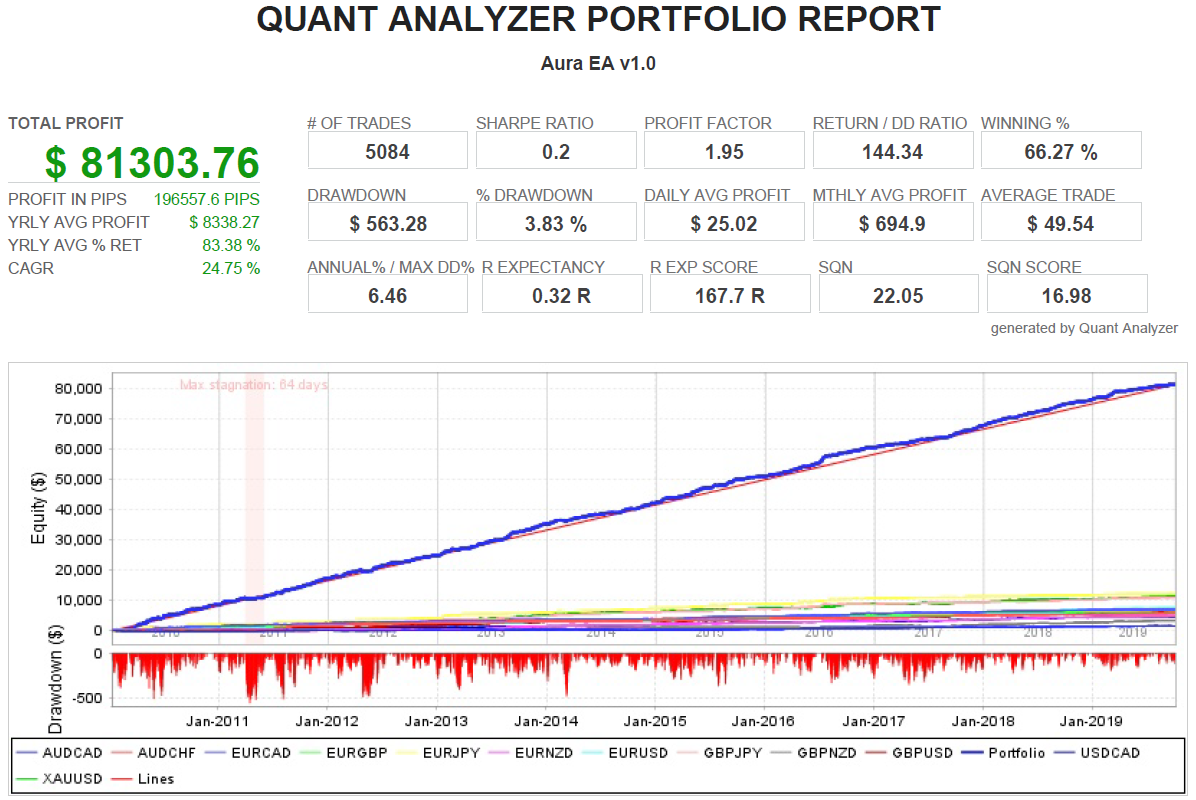
The backtests look extremely good. Therefore, we decided to do a tick data test where the data shifted by 28 years for EURUSD and GBPUSD. We explain at the end of our blog post why such a shift is a useful way to analyze an EA further. The results are much worse, which means that the trades of the EA are for some reason dependent on the exact date even though it is not using any news data. The results look mostly random and therefore we conclude that the trade logic has no significant statistical edge over a random pattern.
Taking a deeper look into the trade history, it seems that some timeframes are skipped. For example, in EURUSD there is no trade before the 2nd april 2010, while the shifted backtest had trades in the first three months of the test. There are several gaps that you could verify yourself.
Our opinion
There is no live signal from the author and there is an inconsistency with regards to a 28 years shift of the tick data. Good reasons to be cautious about the strategy.Live performance
Fixed lot size backtests
Why do we use fixed lot size (0.1 lots)? Check our educational page.
Dukascopy 2019.10.15, version v1.0| Symbol | EURUSD (Euro vs US Dollar) | ||||
| Period | 1 Hour (H1) 2010.01.07 06:00 - 2019.10.04 10:00 (2010.01.01 - 2019.10.10) | ||||
| Model | Every tick (the most precise method based on all available least timeframes) | ||||
| Parameters | ST="----------BASIC SETTING----------"; AutoSetting=true; BelowLimit=4; AboveLimit=5; RiskReward=1; RateSL=2.5; IsUseMM=false; RiskRate=10; StartLotSize=0.1; MaxSpread=50; Slippage=30; comm="AuraMT4"; MagicNumber=777; TimeStart="09:00"; TimeStop="21:30"; BE="----------BREAK EVEN SETTING----------"; BreakEven=false; BreakEvenStart=0.5; BreakEvenPoint=20; TRAIL="----------TRAILLING STOP SETTING----------"; TralingStop=false; TralingStart=0.75; TralingProfit=100; TralingStep=20; | ||||
| Bars in test | 60951 | Ticks modelled | 188313415 | Modelling quality | 99.90% |
| Mismatched charts errors | 0 | ||||
| Initial deposit | 10000.00 | Spread | Variable | ||
| Total net profit | 7429.27 | Gross profit | 14576.70 | Gross loss | -7147.43 |
| Profit factor | 2.04 | Expected payoff | 16.19 | ||
| Absolute drawdown | 52.37 | Maximal drawdown | 335.95 (2.49%) | Relative drawdown | 2.66% (288.67) |
| Total trades | 459 | Short positions (won %) | 268 (67.54%) | Long positions (won %) | 191 (67.02%) |
| Profit trades (% of total) | 309 (67.32%) | Loss trades (% of total) | 150 (32.68%) | ||
| Largest | profit trade | 108.78 | loss trade | -120.71 | |
| Average | profit trade | 47.17 | loss trade | -47.65 | |
| Maximum | consecutive wins (profit in money) | 8 (282.48) | consecutive losses (loss in money) | 4 (-205.33) | |
| Maximal | consecutive profit (count of wins) | 501.78 (7) | consecutive loss (count of losses) | -205.33 (4) | |
| Average | consecutive wins | 3 | consecutive losses | 1 | |

| Symbol | EURUSD (Euro vs US Dollar) | ||||
| Period | 1 Hour (H1) 1982.01.01 00:00 - 1991.09.30 23:00 (1982.01.01 - 1991.10.01) | ||||
| Model | Every tick (the most precise method based on all available least timeframes) | ||||
| Parameters | ST="----------BASIC SETTING----------"; AutoSetting=true; BelowLimit=4; AboveLimit=5; RiskReward=1; RateSL=2.5; IsUseMM=false; RiskRate=10; StartLotSize=0.1; MaxSpread=50; Slippage=30; comm="AuraMT4"; MagicNumber=777; TimeStart="09:00"; TimeStop="21:30"; BE="----------BREAK EVEN SETTING----------"; BreakEven=false; BreakEvenStart=0.5; BreakEvenPoint=20; TRAIL="----------TRAILLING STOP SETTING----------"; TralingStop=false; TralingStart=0.75; TralingProfit=100; TralingStep=20; | ||||
| Bars in test | 62778 | Ticks modelled | 187778878 | Modelling quality | 99.90% |
| Mismatched charts errors | 0 | ||||
| Initial deposit | 5000.00 | Spread | Variable | ||
| Total net profit | 1491.00 | Gross profit | 21010.20 | Gross loss | -19519.20 |
| Profit factor | 1.08 | Expected payoff | 1.76 | ||
| Absolute drawdown | 79.30 | Maximal drawdown | 2242.10 (30.76%) | Relative drawdown | 30.76% (2242.10) |
| Total trades | 849 | Short positions (won %) | 472 (54.87%) | Long positions (won %) | 377 (50.40%) |
| Profit trades (% of total) | 449 (52.89%) | Loss trades (% of total) | 400 (47.11%) | ||
| Largest | profit trade | 108.90 | loss trade | -166.10 | |
| Average | profit trade | 46.79 | loss trade | -48.80 | |
| Maximum | consecutive wins (profit in money) | 10 (298.30) | consecutive losses (loss in money) | 8 (-372.30) | |
| Maximal | consecutive profit (count of wins) | 453.30 (6) | consecutive loss (count of losses) | -459.20 (7) | |
| Average | consecutive wins | 2 | consecutive losses | 2 | |

| Symbol | GBPUSD (Great Britan Pound vs US Dollar) | ||||
| Period | 1 Hour (H1) 2010.01.07 06:00 - 2019.10.04 10:00 (2010.01.01 - 2019.10.10) | ||||
| Model | Every tick (the most precise method based on all available least timeframes) | ||||
| Parameters | ST="----------BASIC SETTING----------"; AutoSetting=true; BelowLimit=4; AboveLimit=5; RiskReward=1; RateSL=2.5; IsUseMM=false; RiskRate=10; StartLotSize=0.1; MaxSpread=50; Slippage=30; comm="AuraMT4"; MagicNumber=777; TimeStart="09:00"; TimeStop="21:30"; BE="----------BREAK EVEN SETTING----------"; BreakEven=false; BreakEvenStart=0.5; BreakEvenPoint=20; TRAIL="----------TRAILLING STOP SETTING----------"; TralingStop=false; TralingStart=0.75; TralingProfit=100; TralingStep=20; | ||||
| Bars in test | 60942 | Ticks modelled | 177047049 | Modelling quality | 99.90% |
| Mismatched charts errors | 0 | ||||
| Initial deposit | 10000.00 | Spread | Variable | ||
| Total net profit | 6538.61 | Gross profit | 14986.38 | Gross loss | -8447.77 |
| Profit factor | 1.77 | Expected payoff | 14.40 | ||
| Absolute drawdown | 169.92 | Maximal drawdown | 345.46 (3.39%) | Relative drawdown | 3.39% (345.46) |
| Total trades | 454 | Short positions (won %) | 254 (62.99%) | Long positions (won %) | 200 (66.00%) |
| Profit trades (% of total) | 292 (64.32%) | Loss trades (% of total) | 162 (35.68%) | ||
| Largest | profit trade | 128.77 | loss trade | -140.25 | |
| Average | profit trade | 51.32 | loss trade | -52.15 | |
| Maximum | consecutive wins (profit in money) | 11 (542.92) | consecutive losses (loss in money) | 5 (-304.99) | |
| Maximal | consecutive profit (count of wins) | 542.92 (11) | consecutive loss (count of losses) | -304.99 (5) | |
| Average | consecutive wins | 3 | consecutive losses | 1 | |

| Symbol | GBPUSD (Great Britain Pound vs US Dollar) | ||||
| Period | 1 Hour (H1) 1982.01.01 00:00 - 1991.09.30 23:00 (1982.01.01 - 1991.10.01) | ||||
| Model | Every tick (the most precise method based on all available least timeframes) | ||||
| Parameters | ST="----------BASIC SETTING----------"; AutoSetting=true; BelowLimit=4; AboveLimit=5; RiskReward=1; RateSL=2.5; IsUseMM=false; RiskRate=10; StartLotSize=0.1; MaxSpread=50; Slippage=30; comm="AuraMT4"; MagicNumber=777; TimeStart="09:00"; TimeStop="21:30"; BE="----------BREAK EVEN SETTING----------"; BreakEven=false; BreakEvenStart=0.5; BreakEvenPoint=20; TRAIL="----------TRAILLING STOP SETTING----------"; TralingStop=false; TralingStart=0.75; TralingProfit=100; TralingStep=20; | ||||
| Bars in test | 62776 | Ticks modelled | 176608789 | Modelling quality | 99.90% |
| Mismatched charts errors | 0 | ||||
| Initial deposit | 5000.00 | Spread | Variable | ||
| Total net profit | -784.00 | Gross profit | 9255.70 | Gross loss | -10039.70 |
| Profit factor | 0.92 | Expected payoff | -2.24 | ||
| Absolute drawdown | 1734.50 | Maximal drawdown | 1974.50 (37.68%) | Relative drawdown | 37.68% (1974.50) |
| Total trades | 350 | Short positions (won %) | 191 (52.36%) | Long positions (won %) | 159 (46.54%) |
| Profit trades (% of total) | 174 (49.71%) | Loss trades (% of total) | 176 (50.29%) | ||
| Largest | profit trade | 100.60 | loss trade | -108.10 | |
| Average | profit trade | 53.19 | loss trade | -57.04 | |
| Maximum | consecutive wins (profit in money) | 9 (407.50) | consecutive losses (loss in money) | 9 (-506.80) | |
| Maximal | consecutive profit (count of wins) | 469.50 (6) | consecutive loss (count of losses) | -506.80 (9) | |
| Average | consecutive wins | 2 | consecutive losses | 2 | |

| Symbol | AUDCAD (Australian Dollar vs Canadian Dollar) | ||||
| Period | 1 Hour (H1) 2010.01.07 06:00 - 2019.10.04 16:00 (2010.01.01 - 2019.10.10) | ||||
| Model | Every tick (the most precise method based on all available least timeframes) | ||||
| Parameters | ST="----------BASIC SETTING----------"; AutoSetting=true; BelowLimit=4; AboveLimit=5; RiskReward=1; RateSL=2.5; IsUseMM=false; RiskRate=10; StartLotSize=0.1; MaxSpread=50; Slippage=30; comm="AuraMT4"; MagicNumber=777; TimeStart="09:00"; TimeStop="21:30"; BE="----------BREAK EVEN SETTING----------"; BreakEven=false; BreakEvenStart=0.5; BreakEvenPoint=20; TRAIL="----------TRAILLING STOP SETTING----------"; TralingStop=false; TralingStart=0.75; TralingProfit=100; TralingStep=20; | ||||
| Bars in test | 60914 | Ticks modelled | 180354158 | Modelling quality | 99.90% |
| Mismatched charts errors | 0 | ||||
| Initial deposit | 10000.00 | Spread | Variable | ||
| Total net profit | 1437.11 | Gross profit | 6014.74 | Gross loss | -4577.63 |
| Profit factor | 1.31 | Expected payoff | 4.05 | ||
| Absolute drawdown | 464.99 | Maximal drawdown | 494.80 (4.93%) | Relative drawdown | 4.93% (494.80) |
| Total trades | 355 | Short positions (won %) | 172 (59.88%) | Long positions (won %) | 183 (56.28%) |
| Profit trades (% of total) | 206 (58.03%) | Loss trades (% of total) | 149 (41.97%) | ||
| Largest | profit trade | 58.37 | loss trade | -59.51 | |
| Average | profit trade | 29.20 | loss trade | -30.72 | |
| Maximum | consecutive wins (profit in money) | 8 (188.11) | consecutive losses (loss in money) | 5 (-149.27) | |
| Maximal | consecutive profit (count of wins) | 265.34 (7) | consecutive loss (count of losses) | -195.29 (4) | |
| Average | consecutive wins | 2 | consecutive losses | 2 | |

| Symbol | AUDCHF (Australian Dollar vs Swiss Franc) | ||||
| Period | 1 Hour (H1) 2010.01.07 06:00 - 2019.10.04 16:00 (2010.01.01 - 2019.10.10) | ||||
| Model | Every tick (the most precise method based on all available least timeframes) | ||||
| Parameters | ST="----------BASIC SETTING----------"; AutoSetting=true; BelowLimit=4; AboveLimit=5; RiskReward=1; RateSL=2.5; IsUseMM=false; RiskRate=10; StartLotSize=0.1; MaxSpread=50; Slippage=30; comm="AuraMT4"; MagicNumber=777; TimeStart="09:00"; TimeStop="21:30"; BE="----------BREAK EVEN SETTING----------"; BreakEven=false; BreakEvenStart=0.5; BreakEvenPoint=20; TRAIL="----------TRAILLING STOP SETTING----------"; TralingStop=false; TralingStart=0.75; TralingProfit=100; TralingStep=20; | ||||
| Bars in test | 60890 | Ticks modelled | 154415548 | Modelling quality | 99.90% |
| Mismatched charts errors | 0 | ||||
| Initial deposit | 10000.00 | Spread | Variable | ||
| Total net profit | 5551.93 | Gross profit | 12058.14 | Gross loss | -6506.21 |
| Profit factor | 1.85 | Expected payoff | 13.13 | ||
| Absolute drawdown | 198.23 | Maximal drawdown | 429.05 (4.19%) | Relative drawdown | 4.19% (429.05) |
| Total trades | 423 | Short positions (won %) | 205 (69.76%) | Long positions (won %) | 218 (61.93%) |
| Profit trades (% of total) | 278 (65.72%) | Loss trades (% of total) | 145 (34.28%) | ||
| Largest | profit trade | 186.52 | loss trade | -153.69 | |
| Average | profit trade | 43.37 | loss trade | -44.87 | |
| Maximum | consecutive wins (profit in money) | 11 (646.77) | consecutive losses (loss in money) | 5 (-328.49) | |
| Maximal | consecutive profit (count of wins) | 654.68 (6) | consecutive loss (count of losses) | -329.62 (4) | |
| Average | consecutive wins | 3 | consecutive losses | 2 | |

| Symbol | EURCAD (Euro vs Canadian Dollar) | ||||
| Period | 1 Hour (H1) 2010.01.08 04:00 - 2019.10.04 16:00 (2010.01.01 - 2019.10.10) | ||||
| Model | Every tick (the most precise method based on all available least timeframes) | ||||
| Parameters | ST="----------BASIC SETTING----------"; AutoSetting=true; BelowLimit=4; AboveLimit=5; RiskReward=1; RateSL=2.5; IsUseMM=false; RiskRate=10; StartLotSize=0.1; MaxSpread=50; Slippage=30; comm="AuraMT4"; MagicNumber=777; TimeStart="09:00"; TimeStop="21:30"; BE="----------BREAK EVEN SETTING----------"; BreakEven=false; BreakEvenStart=0.5; BreakEvenPoint=20; TRAIL="----------TRAILLING STOP SETTING----------"; TralingStop=false; TralingStart=0.75; TralingProfit=100; TralingStep=20; | ||||
| Bars in test | 60895 | Ticks modelled | 228678187 | Modelling quality | 99.90% |
| Mismatched charts errors | 0 | ||||
| Initial deposit | 10000.00 | Spread | Variable | ||
| Total net profit | 6999.78 | Gross profit | 14099.14 | Gross loss | -7099.36 |
| Profit factor | 1.99 | Expected payoff | 14.71 | ||
| Absolute drawdown | 5.47 | Maximal drawdown | 327.03 (2.76%) | Relative drawdown | 2.76% (327.03) |
| Total trades | 476 | Short positions (won %) | 234 (67.09%) | Long positions (won %) | 242 (66.53%) |
| Profit trades (% of total) | 318 (66.81%) | Loss trades (% of total) | 158 (33.19%) | ||
| Largest | profit trade | 111.62 | loss trade | -115.29 | |
| Average | profit trade | 44.34 | loss trade | -44.93 | |
| Maximum | consecutive wins (profit in money) | 13 (474.89) | consecutive losses (loss in money) | 5 (-251.94) | |
| Maximal | consecutive profit (count of wins) | 564.61 (7) | consecutive loss (count of losses) | -251.94 (5) | |
| Average | consecutive wins | 3 | consecutive losses | 1 | |

| Symbol | EURGBP (Euro vs Great Britain Pound ) | ||||
| Period | 1 Hour (H1) 2010.01.07 06:00 - 2019.10.04 16:00 (2010.01.01 - 2019.10.10) | ||||
| Model | Every tick (the most precise method based on all available least timeframes) | ||||
| Parameters | ST="----------BASIC SETTING----------"; AutoSetting=true; BelowLimit=4; AboveLimit=5; RiskReward=1; RateSL=2.5; IsUseMM=false; RiskRate=10; StartLotSize=0.1; MaxSpread=50; Slippage=30; comm="AuraMT4"; MagicNumber=777; TimeStart="09:00"; TimeStop="21:30"; BE="----------BREAK EVEN SETTING----------"; BreakEven=false; BreakEvenStart=0.5; BreakEvenPoint=20; TRAIL="----------TRAILLING STOP SETTING----------"; TralingStop=false; TralingStart=0.75; TralingProfit=100; TralingStep=20; | ||||
| Bars in test | 60942 | Ticks modelled | 158603581 | Modelling quality | 99.90% |
| Mismatched charts errors | 0 | ||||
| Initial deposit | 10000.00 | Spread | Variable | ||
| Total net profit | 6639.50 | Gross profit | 13154.12 | Gross loss | -6514.62 |
| Profit factor | 2.02 | Expected payoff | 13.44 | ||
| Absolute drawdown | 69.53 | Maximal drawdown | 200.71 (1.89%) | Relative drawdown | 1.89% (200.71) |
| Total trades | 494 | Short positions (won %) | 238 (68.49%) | Long positions (won %) | 256 (67.97%) |
| Profit trades (% of total) | 337 (68.22%) | Loss trades (% of total) | 157 (31.78%) | ||
| Largest | profit trade | 110.44 | loss trade | -77.87 | |
| Average | profit trade | 39.03 | loss trade | -41.49 | |
| Maximum | consecutive wins (profit in money) | 12 (330.47) | consecutive losses (loss in money) | 4 (-171.92) | |
| Maximal | consecutive profit (count of wins) | 330.47 (12) | consecutive loss (count of losses) | -171.92 (4) | |
| Average | consecutive wins | 3 | consecutive losses | 1 | |

| Symbol | EURJPY (Euro vs Japanese Yen) | ||||
| Period | 1 Hour (H1) 2010.01.08 04:00 - 2019.10.04 16:00 (2010.01.01 - 2019.10.10) | ||||
| Model | Every tick (the most precise method based on all available least timeframes) | ||||
| Parameters | ST="----------BASIC SETTING----------"; AutoSetting=true; BelowLimit=4; AboveLimit=5; RiskReward=1; RateSL=2.5; IsUseMM=false; RiskRate=10; StartLotSize=0.1; MaxSpread=50; Slippage=30; comm="AuraMT4"; MagicNumber=777; TimeStart="09:00"; TimeStop="21:30"; BE="----------BREAK EVEN SETTING----------"; BreakEven=false; BreakEvenStart=0.5; BreakEvenPoint=20; TRAIL="----------TRAILLING STOP SETTING----------"; TralingStop=false; TralingStart=0.75; TralingProfit=100; TralingStep=20; | ||||
| Bars in test | 60895 | Ticks modelled | 248894050 | Modelling quality | 99.90% |
| Mismatched charts errors | 0 | ||||
| Initial deposit | 10000.00 | Spread | Variable | ||
| Total net profit | 12118.91 | Gross profit | 21580.41 | Gross loss | -9461.50 |
| Profit factor | 2.28 | Expected payoff | 21.11 | ||
| Absolute drawdown | 315.75 | Maximal drawdown | 325.80 (3.25%) | Relative drawdown | 3.25% (325.80) |
| Total trades | 574 | Short positions (won %) | 301 (69.77%) | Long positions (won %) | 273 (69.60%) |
| Profit trades (% of total) | 400 (69.69%) | Loss trades (% of total) | 174 (30.31%) | ||
| Largest | profit trade | 247.60 | loss trade | -154.50 | |
| Average | profit trade | 53.95 | loss trade | -54.38 | |
| Maximum | consecutive wins (profit in money) | 11 (596.01) | consecutive losses (loss in money) | 7 (-303.56) | |
| Maximal | consecutive profit (count of wins) | 741.71 (9) | consecutive loss (count of losses) | -303.56 (7) | |
| Average | consecutive wins | 3 | consecutive losses | 1 | |

| Symbol | EURNZD (Euro vs New Zealand Dollar) | ||||
| Period | 1 Hour (H1) 2010.01.07 09:00 - 2019.10.04 16:00 (2010.01.01 - 2019.10.10) | ||||
| Model | Every tick (the most precise method based on all available least timeframes) | ||||
| Parameters | ST="----------BASIC SETTING----------"; AutoSetting=true; BelowLimit=4; AboveLimit=5; RiskReward=1; RateSL=2.5; IsUseMM=false; RiskRate=10; StartLotSize=0.1; MaxSpread=50; Slippage=30; comm="AuraMT4"; MagicNumber=777; TimeStart="09:00"; TimeStop="21:30"; BE="----------BREAK EVEN SETTING----------"; BreakEven=false; BreakEvenStart=0.5; BreakEvenPoint=20; TRAIL="----------TRAILLING STOP SETTING----------"; TralingStop=false; TralingStart=0.75; TralingProfit=100; TralingStep=20; | ||||
| Bars in test | 60916 | Ticks modelled | 221882958 | Modelling quality | 99.90% |
| Mismatched charts errors | 0 | ||||
| Initial deposit | 10000.00 | Spread | Variable | ||
| Total net profit | 4675.35 | Gross profit | 12034.70 | Gross loss | -7359.35 |
| Profit factor | 1.64 | Expected payoff | 11.19 | ||
| Absolute drawdown | 157.28 | Maximal drawdown | 316.40 (3.07%) | Relative drawdown | 3.07% (316.40) |
| Total trades | 418 | Short positions (won %) | 216 (61.57%) | Long positions (won %) | 202 (64.36%) |
| Profit trades (% of total) | 263 (62.92%) | Loss trades (% of total) | 155 (37.08%) | ||
| Largest | profit trade | 85.99 | loss trade | -176.27 | |
| Average | profit trade | 45.76 | loss trade | -47.48 | |
| Maximum | consecutive wins (profit in money) | 9 (352.36) | consecutive losses (loss in money) | 5 (-249.88) | |
| Maximal | consecutive profit (count of wins) | 460.26 (8) | consecutive loss (count of losses) | -249.88 (5) | |
| Average | consecutive wins | 3 | consecutive losses | 2 | |

| Symbol | GBPJPY (British Pound vs Japanese Yen) | ||||
| Period | 1 Hour (H1) 2010.01.07 06:00 - 2019.10.04 17:00 (2010.01.01 - 2019.10.10) | ||||
| Model | Every tick (the most precise method based on all available least timeframes) | ||||
| Parameters | ST="----------BASIC SETTING----------"; AutoSetting=true; BelowLimit=4; AboveLimit=5; RiskReward=1; RateSL=2.5; IsUseMM=false; RiskRate=10; StartLotSize=0.1; MaxSpread=50; Slippage=30; comm="AuraMT4"; MagicNumber=777; TimeStart="09:00"; TimeStop="21:30"; BE="----------BREAK EVEN SETTING----------"; BreakEven=false; BreakEvenStart=0.5; BreakEvenPoint=20; TRAIL="----------TRAILLING STOP SETTING----------"; TralingStop=false; TralingStart=0.75; TralingProfit=100; TralingStep=20; | ||||
| Bars in test | 60943 | Ticks modelled | 246161300 | Modelling quality | 99.90% |
| Mismatched charts errors | 0 | ||||
| Initial deposit | 10000.00 | Spread | Variable | ||
| Total net profit | 10945.86 | Gross profit | 19141.19 | Gross loss | -8195.33 |
| Profit factor | 2.34 | Expected payoff | 26.25 | ||
| Absolute drawdown | 34.40 | Maximal drawdown | 426.22 (2.48%) | Relative drawdown | 2.92% (348.63) |
| Total trades | 417 | Short positions (won %) | 210 (69.52%) | Long positions (won %) | 207 (70.53%) |
| Profit trades (% of total) | 292 (70.02%) | Loss trades (% of total) | 125 (29.98%) | ||
| Largest | profit trade | 173.58 | loss trade | -121.94 | |
| Average | profit trade | 65.55 | loss trade | -65.56 | |
| Maximum | consecutive wins (profit in money) | 10 (1119.64) | consecutive losses (loss in money) | 3 (-168.23) | |
| Maximal | consecutive profit (count of wins) | 1119.64 (10) | consecutive loss (count of losses) | -238.67 (2) | |
| Average | consecutive wins | 3 | consecutive losses | 1 | |

| Symbol | GBPNZD (Great Britan Pound vs New Zealand Dollar) | ||||
| Period | 1 Hour (H1) 2010.01.07 06:00 - 2019.10.04 17:00 (2010.01.01 - 2019.10.10) | ||||
| Model | Every tick (the most precise method based on all available least timeframes) | ||||
| Parameters | ST="----------BASIC SETTING----------"; AutoSetting=true; BelowLimit=4; AboveLimit=5; RiskReward=1; RateSL=2.5; IsUseMM=false; RiskRate=10; StartLotSize=0.1; MaxSpread=50; Slippage=30; comm="AuraMT4"; MagicNumber=777; TimeStart="09:00"; TimeStop="21:30"; BE="----------BREAK EVEN SETTING----------"; BreakEven=false; BreakEvenStart=0.5; BreakEvenPoint=20; TRAIL="----------TRAILLING STOP SETTING----------"; TralingStop=false; TralingStart=0.75; TralingProfit=100; TralingStep=20; | ||||
| Bars in test | 60845 | Ticks modelled | 226233983 | Modelling quality | 99.90% |
| Mismatched charts errors | 0 | ||||
| Initial deposit | 10000.00 | Spread | Variable | ||
| Total net profit | 3262.26 | Gross profit | 8402.12 | Gross loss | -5139.86 |
| Profit factor | 1.63 | Expected payoff | 13.76 | ||
| Absolute drawdown | 106.10 | Maximal drawdown | 486.92 (4.15%) | Relative drawdown | 4.15% (486.92) |
| Total trades | 237 | Short positions (won %) | 126 (60.32%) | Long positions (won %) | 111 (66.67%) |
| Profit trades (% of total) | 150 (63.29%) | Loss trades (% of total) | 87 (36.71%) | ||
| Largest | profit trade | 132.61 | loss trade | -161.94 | |
| Average | profit trade | 56.01 | loss trade | -59.08 | |
| Maximum | consecutive wins (profit in money) | 8 (490.61) | consecutive losses (loss in money) | 5 (-309.38) | |
| Maximal | consecutive profit (count of wins) | 561.08 (6) | consecutive loss (count of losses) | -309.38 (5) | |
| Average | consecutive wins | 3 | consecutive losses | 2 | |

| Symbol | USDCAD (US Dollar vs Canadian Dollar) | ||||
| Period | 1 Hour (H1) 2010.01.07 06:00 - 2019.10.04 16:00 (2010.01.01 - 2019.10.10) | ||||
| Model | Every tick (the most precise method based on all available least timeframes) | ||||
| Parameters | ST="----------BASIC SETTING----------"; AutoSetting=true; BelowLimit=4; AboveLimit=5; RiskReward=1; RateSL=2.5; IsUseMM=false; RiskRate=10; StartLotSize=0.1; MaxSpread=50; Slippage=30; comm="AuraMT4"; MagicNumber=777; TimeStart="09:00"; TimeStop="21:30"; BE="----------BREAK EVEN SETTING----------"; BreakEven=false; BreakEvenStart=0.5; BreakEvenPoint=20; TRAIL="----------TRAILLING STOP SETTING----------"; TralingStop=false; TralingStart=0.75; TralingProfit=100; TralingStep=20; | ||||
| Bars in test | 60940 | Ticks modelled | 138698225 | Modelling quality | 99.90% |
| Mismatched charts errors | 0 | ||||
| Initial deposit | 10000.00 | Spread | Variable | ||
| Total net profit | 4505.41 | Gross profit | 9791.23 | Gross loss | -5285.83 |
| Profit factor | 1.85 | Expected payoff | 10.94 | ||
| Absolute drawdown | 96.34 | Maximal drawdown | 346.65 (3.38%) | Relative drawdown | 3.38% (346.65) |
| Total trades | 412 | Short positions (won %) | 185 (65.95%) | Long positions (won %) | 227 (66.96%) |
| Profit trades (% of total) | 274 (66.50%) | Loss trades (% of total) | 138 (33.50%) | ||
| Largest | profit trade | 90.96 | loss trade | -103.69 | |
| Average | profit trade | 35.73 | loss trade | -38.30 | |
| Maximum | consecutive wins (profit in money) | 9 (297.81) | consecutive losses (loss in money) | 4 (-72.63) | |
| Maximal | consecutive profit (count of wins) | 314.76 (4) | consecutive loss (count of losses) | -269.35 (3) | |
| Average | consecutive wins | 3 | consecutive losses | 1 | |

| Symbol | XAUUSD (Gold vs US Dollar ) | ||||
| Period | 1 Hour (H1) 2010.01.07 06:00 - 2019.10.04 23:00 (2010.01.01 - 2019.10.10) | ||||
| Model | Every tick (the most precise method based on all available least timeframes) | ||||
| Parameters | ST="----------BASIC SETTING----------"; AutoSetting=true; BelowLimit=4; AboveLimit=5; RiskReward=1; RateSL=2.5; IsUseMM=false; RiskRate=10; StartLotSize=0.1; MaxSpread=50; Slippage=30; comm="AuraMT4"; MagicNumber=777; TimeStart="09:00"; TimeStop="21:30"; BE="----------BREAK EVEN SETTING----------"; BreakEven=false; BreakEvenStart=0.5; BreakEvenPoint=20; TRAIL="----------TRAILLING STOP SETTING----------"; TralingStop=false; TralingStart=0.75; TralingProfit=100; TralingStep=20; | ||||
| Bars in test | 58936 | Ticks modelled | 278135927 | Modelling quality | 99.90% |
| Mismatched charts errors | 0 | ||||
| Initial deposit | 10000.00 | Spread | Variable | ||
| Total net profit | 11199.96 | Gross profit | 20737.94 | Gross loss | -9537.98 |
| Profit factor | 2.17 | Expected payoff | 30.68 | ||
| Absolute drawdown | 60.86 | Maximal drawdown | 521.51 (2.71%) | Relative drawdown | 3.83% (487.97) |
| Total trades | 365 | Short positions (won %) | 199 (69.85%) | Long positions (won %) | 166 (66.87%) |
| Profit trades (% of total) | 250 (68.49%) | Loss trades (% of total) | 115 (31.51%) | ||
| Largest | profit trade | 367.90 | loss trade | -203.00 | |
| Average | profit trade | 82.95 | loss trade | -82.94 | |
| Maximum | consecutive wins (profit in money) | 16 (1386.88) | consecutive losses (loss in money) | 6 (-330.73) | |
| Maximal | consecutive profit (count of wins) | 1386.88 (16) | consecutive loss (count of losses) | -360.24 (3) | |
| Average | consecutive wins | 3 | consecutive losses | 1 | |

All EA reviews (15)
Latest EA reviews
AutoGenEA
An EA that is developed by Generic Machine Learning. Check it out
Momentum EA BOA
A momentum / trend following strategy with good and stable backtests.
Scalperinho EA
A very promissing EA that trades intraday pullbacks on a impressive number of 28 pairs.
StarX
A cheap night scalper with promising backtests. Check it out.
Inertia EA Extra
A S/R scalper for the EURUSD pair with an impressive backtest.
SFE Night Scalper
An asian scalper with a 4 years old live account. Check out our review
Aura MT4
A trend follwing system with inconsistent backtests.
SFE Stealth
Promising new Asian scalper with good live results. Check out our review.
FXStabilizer PRO
A martingale system which survived astonishing long in live trading
Mito EA
A trend / counter trend system that trades 31 different pairs. Check it out
FXAdept
A successful trend following EA with nearly two years of live history. Check out our review.
Bazava
A quite cheap intraday scalper for the NZDUSD. Is it worth the money? Check it out.
Tesseract
A counter-trend system with inconsistent backtests
Legend
A combination of a momentum based strategy and an SR level breakout system
CEF Phantom Scalper
An aggressive intraday counter-trend scalper on M1 time frame