EA review - Scalperinho EA
| Rating total: | |
| Backtests: | |
| Live performance: | |
| Risk control: | |
| Customizability: | |
| Price: |
| Vendor link | Price: | $250 (2020.07.18) |
| Trading strategy: | Counter-Trend |
| Vendor live account: | Yes |
| Own live account: | No |
| Latest tested version: | v1.1 |
| Latest tested date: | 2019.10.28 |
| Risk factors: | Over - optimisation |
This EA has been removed from the market. If you are still interested, you could try to contact the seller directly via his profile.
Scalperinho EA uses various indicators to enter and exit the market.
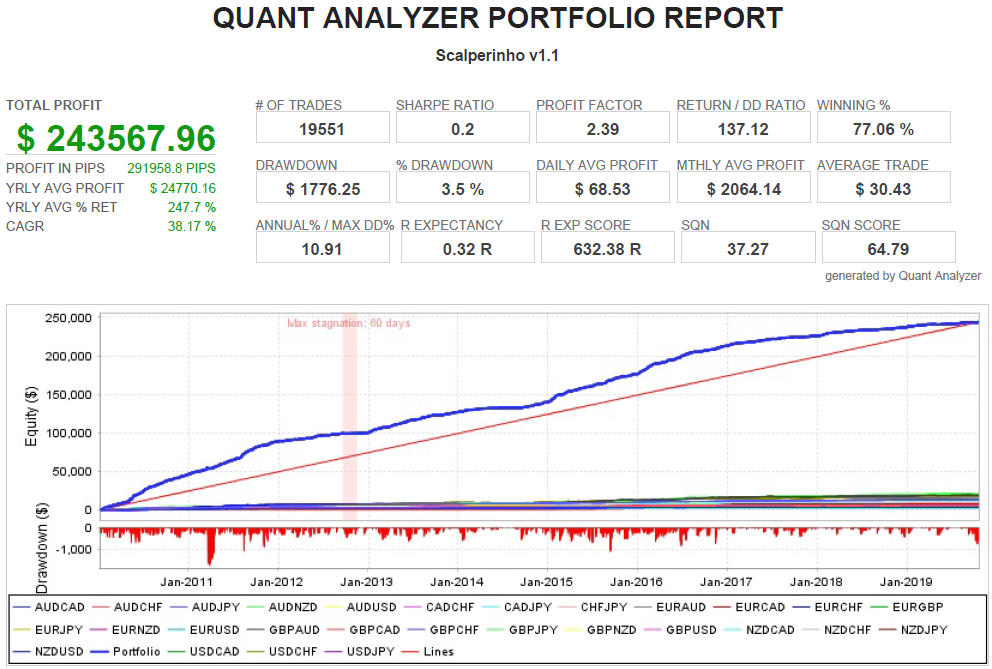
The provided set files from the author are using the M15 timeframe on an impressive number of 28 pairs. All backtests are profitable in our tests. Some are quite impressive. A 28 year shift backtest showed similiar results, therefore this backtests seems to be valid.
Most of the trades that we analysed in the visual backtests are trading a pullback, after a strong movement.
The name of this EA implies that it scalps the market, but we think that this is missleading. There are many trades that are closed with over +50 pips and/or are held for many weeks, however, the average loss (and largest loss) is bigger than the average win.
Some interesting facts from our backtest portfolio:
- The average monthly profit ($2064.14) is larger than the max. drawdown ($1776.25) for 0.10 lot on all 28 pairs
- The max. stagnation period was only 60 days.
- The average win (for 0.10 lot) is $27.83, the average loss $-39.17 with a win rate of 77%
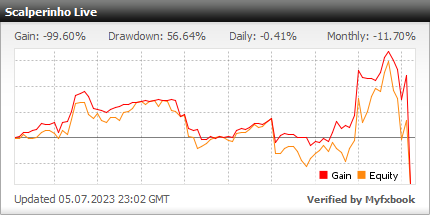
The author provides a live account with a relatively short history. Please also note that the mql signal shows a much higher drawdown than the mfxbook signal because myfxbook does not calculate the intraday drawdown correctly.
We will review this EA again when there is a longer live history.
Our opinion
The live account history of this EA is too short for a final assessment, but if it continues to perform stably for the next few months, we think that this EA could be worth to be added in a portfolio.Live performance
Fixed lot size backtests
Why do we use fixed lot size (0.1 lots)? Check our educational page.
Dukascopy 2019.10.28, version v1.1| Symbol | AUDCAD (Australian Dollar vs Canadian Dollar) | ||||
| Period | 15 Minutes (M15) 2010.01.01 02:00 - 2019.10.17 20:30 (2010.01.01 - 2019.10.23) | ||||
| Model | Every tick (the most precise method based on all available least timeframes) | ||||
| Parameters | MM="Money Management"; Fixed_Lot=0.1; Reinvestment_Risk=0; TPar="Trading Parameters"; TrendFilter1=3; TrendFilter2=5; TrendFilter3=40; OscillatorFilter1=9; OscillatorFilter2=10; WPR_Close=-6; MA_Period=120; CCI_Period=24; ATR_Period=12; WPR_Period=24; ATR_Limit=10; MaxCCI=90; BE_value=8; BE_points=40; OppositeSignal_Close=6; TakeProfit=180; StopLoss=460; MagicNumber=777; MaxSpread=100; Slippage=2; OrderComments="Scalperinho"; | ||||
| Bars in test | 244560 | Ticks modelled | 184383889 | Modelling quality | 99.90% |
| Mismatched charts errors | 0 | ||||
| Initial deposit | 10000.00 | Spread | Variable | ||
| Total net profit | 3533.55 | Gross profit | 9631.35 | Gross loss | -6097.80 |
| Profit factor | 1.58 | Expected payoff | 4.26 | ||
| Absolute drawdown | 316.42 | Maximal drawdown | 451.51 (4.45%) | Relative drawdown | 4.45% (451.51) |
| Total trades | 829 | Short positions (won %) | 418 (64.35%) | Long positions (won %) | 411 (62.77%) |
| Profit trades (% of total) | 527 (63.57%) | Loss trades (% of total) | 302 (36.43%) | ||
| Largest | profit trade | 150.18 | loss trade | -48.22 | |
| Average | profit trade | 18.28 | loss trade | -20.19 | |
| Maximum | consecutive wins (profit in money) | 12 (175.38) | consecutive losses (loss in money) | 9 (-228.26) | |
| Maximal | consecutive profit (count of wins) | 264.15 (9) | consecutive loss (count of losses) | -228.26 (9) | |
| Average | consecutive wins | 3 | consecutive losses | 2 | |

| Symbol | AUDCHF (Australian Dollar vs Swiss Franc) | ||||
| Period | 15 Minutes (M15) 2010.01.04 03:00 - 2019.10.17 20:30 (2010.01.01 - 2019.10.23) | ||||
| Model | Every tick (the most precise method based on all available least timeframes) | ||||
| Parameters | MM="Money Management"; Fixed_Lot=0.1; Reinvestment_Risk=0; TPar="Trading Parameters"; TrendFilter1=0; TrendFilter2=35; TrendFilter3=40; OscillatorFilter1=9; OscillatorFilter2=6; WPR_Close=-2; MA_Period=48; CCI_Period=24; ATR_Period=60; WPR_Period=48; ATR_Limit=4; MaxCCI=80; BE_value=8; BE_points=20; OppositeSignal_Close=4; TakeProfit=180; StopLoss=420; MagicNumber=777; MaxSpread=100; Slippage=2; OrderComments="Scalperinho"; | ||||
| Bars in test | 244354 | Ticks modelled | 155014741 | Modelling quality | 99.90% |
| Mismatched charts errors | 0 | ||||
| Initial deposit | 10000.00 | Spread | Variable | ||
| Total net profit | 5469.39 | Gross profit | 7711.97 | Gross loss | -2242.58 |
| Profit factor | 3.44 | Expected payoff | 12.93 | ||
| Absolute drawdown | 310.10 | Maximal drawdown | 472.28 (3.04%) | Relative drawdown | 4.14% (419.70) |
| Total trades | 423 | Short positions (won %) | 252 (74.21%) | Long positions (won %) | 171 (80.70%) |
| Profit trades (% of total) | 325 (76.83%) | Loss trades (% of total) | 98 (23.17%) | ||
| Largest | profit trade | 181.15 | loss trade | -63.92 | |
| Average | profit trade | 23.73 | loss trade | -22.88 | |
| Maximum | consecutive wins (profit in money) | 36 (1312.04) | consecutive losses (loss in money) | 5 (-141.39) | |
| Maximal | consecutive profit (count of wins) | 1312.04 (36) | consecutive loss (count of losses) | -141.39 (5) | |
| Average | consecutive wins | 5 | consecutive losses | 2 | |

| Symbol | AUDJPY (Australian Dollar vs Japanese Yen) | ||||
| Period | 15 Minutes (M15) 2010.01.04 03:00 - 2019.10.17 22:00 (2010.01.01 - 2019.10.23) | ||||
| Model | Every tick (the most precise method based on all available least timeframes) | ||||
| Parameters | MM="Money Management"; Fixed_Lot=0.1; Reinvestment_Risk=0; TPar="Trading Parameters"; TrendFilter1=5; TrendFilter2=30; TrendFilter3=30; OscillatorFilter1=9; OscillatorFilter2=6; WPR_Close=0; MA_Period=84; CCI_Period=24; ATR_Period=48; WPR_Period=72; ATR_Limit=8; MaxCCI=160; BE_value=3; BE_points=35; OppositeSignal_Close=2; TakeProfit=58; StopLoss=270; MagicNumber=777; MaxSpread=100; Slippage=2; OrderComments="Scalperinho"; | ||||
| Bars in test | 244626 | Ticks modelled | 198988187 | Modelling quality | 99.90% |
| Mismatched charts errors | 0 | ||||
| Initial deposit | 10000.00 | Spread | Variable | ||
| Total net profit | 13006.63 | Gross profit | 17815.07 | Gross loss | -4808.44 |
| Profit factor | 3.70 | Expected payoff | 25.86 | ||
| Absolute drawdown | 89.65 | Maximal drawdown | 544.32 (3.20%) | Relative drawdown | 3.55% (382.61) |
| Total trades | 503 | Short positions (won %) | 291 (94.85%) | Long positions (won %) | 212 (98.11%) |
| Profit trades (% of total) | 484 (96.22%) | Loss trades (% of total) | 19 (3.78%) | ||
| Largest | profit trade | 102.10 | loss trade | -283.63 | |
| Average | profit trade | 36.81 | loss trade | -253.08 | |
| Maximum | consecutive wins (profit in money) | 75 (2960.75) | consecutive losses (loss in money) | 1 (-283.63) | |
| Maximal | consecutive profit (count of wins) | 2960.75 (75) | consecutive loss (count of losses) | -283.63 (1) | |
| Average | consecutive wins | 24 | consecutive losses | 1 | |

| Symbol | AUDNZD (Australian Dollar vs New Zealand Dollar) | ||||
| Period | 15 Minutes (M15) 2010.01.01 02:00 - 2019.10.17 22:00 (2010.01.01 - 2019.10.23) | ||||
| Model | Every tick (the most precise method based on all available least timeframes) | ||||
| Parameters | MM="Money Management"; Fixed_Lot=0.1; Reinvestment_Risk=0; TPar="Trading Parameters"; TrendFilter1=8; TrendFilter2=10; TrendFilter3=40; OscillatorFilter1=9; OscillatorFilter2=8; WPR_Close=-8; MA_Period=84; CCI_Period=24; ATR_Period=48; WPR_Period=24; ATR_Limit=10; MaxCCI=100; BE_value=8; BE_points=30; OppositeSignal_Close=10; TakeProfit=160; StopLoss=380; MagicNumber=777; MaxSpread=100; Slippage=2; OrderComments="Scalperinho"; | ||||
| Bars in test | 244707 | Ticks modelled | 183268905 | Modelling quality | 99.90% |
| Mismatched charts errors | 0 | ||||
| Initial deposit | 10000.00 | Spread | Variable | ||
| Total net profit | 2788.02 | Gross profit | 8682.95 | Gross loss | -5894.93 |
| Profit factor | 1.47 | Expected payoff | 3.23 | ||
| Absolute drawdown | 10.89 | Maximal drawdown | 419.01 (3.45%) | Relative drawdown | 3.45% (419.01) |
| Total trades | 864 | Short positions (won %) | 414 (66.91%) | Long positions (won %) | 450 (70.89%) |
| Profit trades (% of total) | 596 (68.98%) | Loss trades (% of total) | 268 (31.02%) | ||
| Largest | profit trade | 100.23 | loss trade | -254.28 | |
| Average | profit trade | 14.57 | loss trade | -22.00 | |
| Maximum | consecutive wins (profit in money) | 14 (239.08) | consecutive losses (loss in money) | 8 (-217.36) | |
| Maximal | consecutive profit (count of wins) | 239.08 (14) | consecutive loss (count of losses) | -254.28 (1) | |
| Average | consecutive wins | 3 | consecutive losses | 1 | |

| Symbol | AUDUSD (Australian Dollar vs US Dollar) | ||||
| Period | 15 Minutes (M15) 2010.01.04 03:00 - 2019.10.17 22:45 (2010.01.01 - 2019.10.23) | ||||
| Model | Every tick (the most precise method based on all available least timeframes) | ||||
| Parameters | MM="Money Management"; Fixed_Lot=0.1; Reinvestment_Risk=0; TPar="Trading Parameters"; TrendFilter1=20; TrendFilter2=10; TrendFilter3=25; OscillatorFilter1=9; OscillatorFilter2=8; WPR_Close=0; MA_Period=96; CCI_Period=84; ATR_Period=36; WPR_Period=54; ATR_Limit=6; MaxCCI=100; BE_value=1; BE_points=30; OppositeSignal_Close=3; TakeProfit=42; StopLoss=250; MagicNumber=777; MaxSpread=100; Slippage=2; OrderComments="Scalperinho"; | ||||
| Bars in test | 244243 | Ticks modelled | 144099375 | Modelling quality | 99.90% |
| Mismatched charts errors | 0 | ||||
| Initial deposit | 10000.00 | Spread | Variable | ||
| Total net profit | 12591.75 | Gross profit | 17150.69 | Gross loss | -4558.94 |
| Profit factor | 3.76 | Expected payoff | 22.98 | ||
| Absolute drawdown | 22.46 | Maximal drawdown | 551.62 (3.73%) | Relative drawdown | 3.73% (551.62) |
| Total trades | 548 | Short positions (won %) | 304 (97.37%) | Long positions (won %) | 244 (94.67%) |
| Profit trades (% of total) | 527 (96.17%) | Loss trades (% of total) | 21 (3.83%) | ||
| Largest | profit trade | 67.31 | loss trade | -258.94 | |
| Average | profit trade | 32.54 | loss trade | -217.09 | |
| Maximum | consecutive wins (profit in money) | 88 (2731.88) | consecutive losses (loss in money) | 1 (-258.94) | |
| Maximal | consecutive profit (count of wins) | 2731.88 (88) | consecutive loss (count of losses) | -258.94 (1) | |
| Average | consecutive wins | 24 | consecutive losses | 1 | |

| Symbol | CADCHF (Canadian Dollar vs Swiss Franc) | ||||
| Period | 15 Minutes (M15) 2010.01.04 03:00 - 2019.10.17 23:15 (2010.01.01 - 2019.10.23) | ||||
| Model | Every tick (the most precise method based on all available least timeframes) | ||||
| Parameters | MM="Money Management"; Fixed_Lot=0.1; Reinvestment_Risk=0; TPar="Trading Parameters"; TrendFilter1=8; TrendFilter2=45; TrendFilter3=40; OscillatorFilter1=9; OscillatorFilter2=5; WPR_Close=-2; MA_Period=36; CCI_Period=24; ATR_Period=36; WPR_Period=24; ATR_Limit=6; MaxCCI=100; BE_value=4; BE_points=30; OppositeSignal_Close=2; TakeProfit=30; StopLoss=280; MagicNumber=777; MaxSpread=100; Slippage=2; OrderComments="Scalperinho"; | ||||
| Bars in test | 244274 | Ticks modelled | 134400013 | Modelling quality | 99.90% |
| Mismatched charts errors | 0 | ||||
| Initial deposit | 10000.00 | Spread | Variable | ||
| Total net profit | 5850.22 | Gross profit | 6416.22 | Gross loss | -566.00 |
| Profit factor | 11.34 | Expected payoff | 17.52 | ||
| Absolute drawdown | 50.06 | Maximal drawdown | 254.01 (1.79%) | Relative drawdown | 2.35% (242.21) |
| Total trades | 334 | Short positions (won %) | 201 (84.58%) | Long positions (won %) | 133 (79.70%) |
| Profit trades (% of total) | 276 (82.63%) | Loss trades (% of total) | 58 (17.37%) | ||
| Largest | profit trade | 54.74 | loss trade | -20.53 | |
| Average | profit trade | 23.25 | loss trade | -9.76 | |
| Maximum | consecutive wins (profit in money) | 21 (525.04) | consecutive losses (loss in money) | 4 (-57.04) | |
| Maximal | consecutive profit (count of wins) | 525.04 (21) | consecutive loss (count of losses) | -57.04 (4) | |
| Average | consecutive wins | 6 | consecutive losses | 1 | |

| Symbol | CADJPY (Canadian Dollar vs Japanese Yen) | ||||
| Period | 15 Minutes (M15) 2010.01.04 00:00 - 2019.10.17 23:15 (2010.01.01 - 2019.10.23) | ||||
| Model | Every tick (the most precise method based on all available least timeframes) | ||||
| Parameters | MM="Money Management"; Fixed_Lot=0.1; Reinvestment_Risk=0; TPar="Trading Parameters"; TrendFilter1=10; TrendFilter2=50; TrendFilter3=40; OscillatorFilter1=9; OscillatorFilter2=9; WPR_Close=-2; MA_Period=72; CCI_Period=24; ATR_Period=24; WPR_Period=12; ATR_Limit=8; MaxCCI=80; BE_value=10; BE_points=60; OppositeSignal_Close=2; TakeProfit=190; StopLoss=200; MagicNumber=777; MaxSpread=100; Slippage=2; OrderComments="Scalperinho"; | ||||
| Bars in test | 244508 | Ticks modelled | 195235315 | Modelling quality | 99.90% |
| Mismatched charts errors | 0 | ||||
| Initial deposit | 10000.00 | Spread | Variable | ||
| Total net profit | 11489.02 | Gross profit | 24352.35 | Gross loss | -12863.33 |
| Profit factor | 1.89 | Expected payoff | 9.42 | ||
| Absolute drawdown | 165.72 | Maximal drawdown | 637.33 (5.30%) | Relative drawdown | 5.30% (637.33) |
| Total trades | 1219 | Short positions (won %) | 688 (73.55%) | Long positions (won %) | 531 (72.50%) |
| Profit trades (% of total) | 891 (73.09%) | Loss trades (% of total) | 328 (26.91%) | ||
| Largest | profit trade | 262.07 | loss trade | -220.93 | |
| Average | profit trade | 27.33 | loss trade | -39.22 | |
| Maximum | consecutive wins (profit in money) | 21 (519.13) | consecutive losses (loss in money) | 5 (-59.03) | |
| Maximal | consecutive profit (count of wins) | 519.13 (21) | consecutive loss (count of losses) | -380.38 (2) | |
| Average | consecutive wins | 4 | consecutive losses | 1 | |

| Symbol | CHFJPY (Swiss Frank vs Japanese Yen) | ||||
| Period | 15 Minutes (M15) 2010.01.04 03:00 - 2019.10.18 09:30 (2010.01.01 - 2019.10.23) | ||||
| Model | Every tick (the most precise method based on all available least timeframes) | ||||
| Parameters | MM="Money Management"; Fixed_Lot=0.1; Reinvestment_Risk=0; TPar="Trading Parameters"; TrendFilter1=3; TrendFilter2=5; TrendFilter3=40; OscillatorFilter1=9; OscillatorFilter2=6; WPR_Close=-2; MA_Period=120; CCI_Period=24; ATR_Period=36; WPR_Period=42; ATR_Limit=14; MaxCCI=20; BE_value=4; BE_points=20; OppositeSignal_Close=2; TakeProfit=150; StopLoss=280; MagicNumber=777; MaxSpread=100; Slippage=2; OrderComments="Scalperinho"; | ||||
| Bars in test | 244626 | Ticks modelled | 192594693 | Modelling quality | 99.90% |
| Mismatched charts errors | 0 | ||||
| Initial deposit | 10000.00 | Spread | Variable | ||
| Total net profit | 9903.75 | Gross profit | 15229.57 | Gross loss | -5325.82 |
| Profit factor | 2.86 | Expected payoff | 13.85 | ||
| Absolute drawdown | 35.94 | Maximal drawdown | 649.36 (3.64%) | Relative drawdown | 5.22% (608.85) |
| Total trades | 715 | Short positions (won %) | 431 (87.01%) | Long positions (won %) | 284 (90.85%) |
| Profit trades (% of total) | 633 (88.53%) | Loss trades (% of total) | 82 (11.47%) | ||
| Largest | profit trade | 141.96 | loss trade | -290.12 | |
| Average | profit trade | 24.06 | loss trade | -64.95 | |
| Maximum | consecutive wins (profit in money) | 36 (886.68) | consecutive losses (loss in money) | 3 (-38.59) | |
| Maximal | consecutive profit (count of wins) | 886.68 (36) | consecutive loss (count of losses) | -290.12 (1) | |
| Average | consecutive wins | 9 | consecutive losses | 1 | |

| Symbol | EURAUD (Euro vs Australian Dollar) | ||||
| Period | 15 Minutes (M15) 2010.01.04 00:00 - 2019.10.18 07:45 (2010.01.01 - 2019.10.23) | ||||
| Model | Every tick (the most precise method based on all available least timeframes) | ||||
| Parameters | MM="Money Management"; Fixed_Lot=0.1; Reinvestment_Risk=0; TPar="Trading Parameters"; TrendFilter1=0; TrendFilter2=35; TrendFilter3=40; OscillatorFilter1=9; OscillatorFilter2=7; WPR_Close=-6; MA_Period=48; CCI_Period=24; ATR_Period=36; WPR_Period=48; ATR_Limit=14; MaxCCI=70; BE_value=2; BE_points=30; OppositeSignal_Close=4; TakeProfit=170; StopLoss=460; MagicNumber=777; MaxSpread=100; Slippage=2; OrderComments="Scalperinho"; | ||||
| Bars in test | 244489 | Ticks modelled | 254448244 | Modelling quality | 99.90% |
| Mismatched charts errors | 0 | ||||
| Initial deposit | 10000.00 | Spread | Variable | ||
| Total net profit | 6503.32 | Gross profit | 8752.27 | Gross loss | -2248.95 |
| Profit factor | 3.89 | Expected payoff | 15.41 | ||
| Absolute drawdown | 21.38 | Maximal drawdown | 528.43 (4.01%) | Relative drawdown | 4.01% (528.43) |
| Total trades | 422 | Short positions (won %) | 190 (80.53%) | Long positions (won %) | 232 (81.03%) |
| Profit trades (% of total) | 341 (80.81%) | Loss trades (% of total) | 81 (19.19%) | ||
| Largest | profit trade | 217.69 | loss trade | -315.20 | |
| Average | profit trade | 25.67 | loss trade | -27.76 | |
| Maximum | consecutive wins (profit in money) | 29 (730.08) | consecutive losses (loss in money) | 5 (-105.70) | |
| Maximal | consecutive profit (count of wins) | 730.08 (29) | consecutive loss (count of losses) | -325.10 (2) | |
| Average | consecutive wins | 5 | consecutive losses | 1 | |

| Symbol | EURCAD (Euro vs Canadian Dollar) | ||||
| Period | 15 Minutes (M15) 2010.01.04 00:00 - 2019.10.18 09:30 (2010.01.01 - 2019.10.23) | ||||
| Model | Every tick (the most precise method based on all available least timeframes) | ||||
| Parameters | MM="Money Management"; Fixed_Lot=0.1; Reinvestment_Risk=0; TPar="Trading Parameters"; TrendFilter1=1; TrendFilter2=25; TrendFilter3=40; OscillatorFilter1=9; OscillatorFilter2=10; WPR_Close=-2; MA_Period=24; CCI_Period=24; ATR_Period=48; WPR_Period=12; ATR_Limit=14; MaxCCI=50; BE_value=8; BE_points=40; OppositeSignal_Close=2; TakeProfit=50; StopLoss=360; MagicNumber=777; MaxSpread=100; Slippage=2; OrderComments="Scalperinho"; | ||||
| Bars in test | 244504 | Ticks modelled | 236074240 | Modelling quality | 99.90% |
| Mismatched charts errors | 0 | ||||
| Initial deposit | 10000.00 | Spread | Variable | ||
| Total net profit | 8737.21 | Gross profit | 11609.56 | Gross loss | -2872.35 |
| Profit factor | 4.04 | Expected payoff | 14.99 | ||
| Absolute drawdown | 246.12 | Maximal drawdown | 521.48 (4.19%) | Relative drawdown | 4.19% (521.48) |
| Total trades | 583 | Short positions (won %) | 286 (80.77%) | Long positions (won %) | 297 (78.45%) |
| Profit trades (% of total) | 464 (79.59%) | Loss trades (% of total) | 119 (20.41%) | ||
| Largest | profit trade | 118.43 | loss trade | -298.56 | |
| Average | profit trade | 25.02 | loss trade | -24.14 | |
| Maximum | consecutive wins (profit in money) | 26 (742.50) | consecutive losses (loss in money) | 3 (-297.10) | |
| Maximal | consecutive profit (count of wins) | 742.50 (26) | consecutive loss (count of losses) | -298.56 (1) | |
| Average | consecutive wins | 5 | consecutive losses | 1 | |

| Symbol | EURCHF (Euro vs Swiss Franc) | ||||
| Period | 15 Minutes (M15) 2010.01.04 03:00 - 2019.10.18 10:00 (2010.01.01 - 2019.10.23) | ||||
| Model | Every tick (the most precise method based on all available least timeframes) | ||||
| Parameters | MM="Money Management"; Fixed_Lot=0.1; Reinvestment_Risk=0; TPar="Trading Parameters"; TrendFilter1=2; TrendFilter2=25; TrendFilter3=40; OscillatorFilter1=9; OscillatorFilter2=4; WPR_Close=-2; MA_Period=108; CCI_Period=24; ATR_Period=24; WPR_Period=12; ATR_Limit=12; MaxCCI=80; BE_value=8; BE_points=40; OppositeSignal_Close=2; TakeProfit=130; StopLoss=340; MagicNumber=777; MaxSpread=100; Slippage=2; OrderComments="Scalperinho"; | ||||
| Bars in test | 244619 | Ticks modelled | 124243463 | Modelling quality | 99.90% |
| Mismatched charts errors | 0 | ||||
| Initial deposit | 10000.00 | Spread | Variable | ||
| Total net profit | 8026.10 | Gross profit | 13959.49 | Gross loss | -5933.39 |
| Profit factor | 2.35 | Expected payoff | 15.17 | ||
| Absolute drawdown | 145.90 | Maximal drawdown | 699.33 (4.08%) | Relative drawdown | 4.29% (552.68) |
| Total trades | 529 | Short positions (won %) | 300 (79.00%) | Long positions (won %) | 229 (70.31%) |
| Profit trades (% of total) | 398 (75.24%) | Loss trades (% of total) | 131 (24.76%) | ||
| Largest | profit trade | 135.01 | loss trade | -356.68 | |
| Average | profit trade | 35.07 | loss trade | -45.29 | |
| Maximum | consecutive wins (profit in money) | 22 (680.04) | consecutive losses (loss in money) | 4 (-58.66) | |
| Maximal | consecutive profit (count of wins) | 777.48 (16) | consecutive loss (count of losses) | -364.02 (3) | |
| Average | consecutive wins | 4 | consecutive losses | 1 | |

| Symbol | EURGBP (Euro vs Great Britain Pound ) | ||||
| Period | 15 Minutes (M15) 2010.01.04 03:00 - 2019.10.18 10:15 (2010.01.01 - 2019.10.23) | ||||
| Model | Every tick (the most precise method based on all available least timeframes) | ||||
| Parameters | MM="Money Management"; Fixed_Lot=0.1; Reinvestment_Risk=0; TPar="Trading Parameters"; TrendFilter1=35; TrendFilter2=10; TrendFilter3=40; OscillatorFilter1=10; OscillatorFilter2=8; WPR_Close=-1; MA_Period=96; CCI_Period=24; ATR_Period=12; WPR_Period=72; ATR_Limit=7; MaxCCI=260; BE_value=6; BE_points=50; OppositeSignal_Close=5; TakeProfit=52; StopLoss=270; MagicNumber=777; MaxSpread=100; Slippage=2; OrderComments="Scalperinho"; | ||||
| Bars in test | 244611 | Ticks modelled | 159679499 | Modelling quality | 99.90% |
| Mismatched charts errors | 0 | ||||
| Initial deposit | 10000.00 | Spread | Variable | ||
| Total net profit | 6036.94 | Gross profit | 8503.59 | Gross loss | -2466.65 |
| Profit factor | 3.45 | Expected payoff | 25.80 | ||
| Absolute drawdown | 69.25 | Maximal drawdown | 570.02 (4.28%) | Relative drawdown | 4.28% (570.02) |
| Total trades | 234 | Short positions (won %) | 114 (79.82%) | Long positions (won %) | 120 (72.50%) |
| Profit trades (% of total) | 178 (76.07%) | Loss trades (% of total) | 56 (23.93%) | ||
| Largest | profit trade | 146.36 | loss trade | -378.63 | |
| Average | profit trade | 47.77 | loss trade | -44.05 | |
| Maximum | consecutive wins (profit in money) | 14 (635.08) | consecutive losses (loss in money) | 3 (-46.52) | |
| Maximal | consecutive profit (count of wins) | 635.08 (14) | consecutive loss (count of losses) | -407.92 (2) | |
| Average | consecutive wins | 4 | consecutive losses | 1 | |

| Symbol | EURJPY (Euro vs Japanese Yen) | ||||
| Period | 15 Minutes (M15) 2010.01.05 01:00 - 2019.10.18 10:30 (2010.01.01 - 2019.10.23) | ||||
| Model | Every tick (the most precise method based on all available least timeframes) | ||||
| Parameters | MM="Money Management"; Fixed_Lot=0.1; Reinvestment_Risk=0; TPar="Trading Parameters"; TrendFilter1=20; TrendFilter2=50; TrendFilter3=20; OscillatorFilter1=9; OscillatorFilter2=8; WPR_Close=0; MA_Period=36; CCI_Period=72; ATR_Period=48; WPR_Period=18; ATR_Limit=6; MaxCCI=300; BE_value=6; BE_points=50; OppositeSignal_Close=12; TakeProfit=100; StopLoss=440; MagicNumber=777; MaxSpread=100; Slippage=2; OrderComments="Scalperinho"; | ||||
| Bars in test | 244406 | Ticks modelled | 250317039 | Modelling quality | 99.90% |
| Mismatched charts errors | 0 | ||||
| Initial deposit | 10000.00 | Spread | Variable | ||
| Total net profit | 10788.68 | Gross profit | 12489.37 | Gross loss | -1700.70 |
| Profit factor | 7.34 | Expected payoff | 26.00 | ||
| Absolute drawdown | 69.51 | Maximal drawdown | 722.42 (3.86%) | Relative drawdown | 6.01% (654.05) |
| Total trades | 415 | Short positions (won %) | 243 (98.35%) | Long positions (won %) | 172 (100.00%) |
| Profit trades (% of total) | 411 (99.04%) | Loss trades (% of total) | 4 (0.96%) | ||
| Largest | profit trade | 183.31 | loss trade | -467.95 | |
| Average | profit trade | 30.39 | loss trade | -425.17 | |
| Maximum | consecutive wins (profit in money) | 163 (5185.84) | consecutive losses (loss in money) | 1 (-467.95) | |
| Maximal | consecutive profit (count of wins) | 5185.84 (163) | consecutive loss (count of losses) | -467.95 (1) | |
| Average | consecutive wins | 82 | consecutive losses | 1 | |

| Symbol | EURNZD (Euro vs New Zealand Dollar) | ||||
| Period | 15 Minutes (M15) 2010.01.01 02:00 - 2019.10.18 11:00 (2010.01.01 - 2019.10.23) | ||||
| Model | Every tick (the most precise method based on all available least timeframes) | ||||
| Parameters | MM="Money Management"; Fixed_Lot=0.1; Reinvestment_Risk=0; TPar="Trading Parameters"; TrendFilter1=2; TrendFilter2=0; TrendFilter3=40; OscillatorFilter1=9; OscillatorFilter2=7; WPR_Close=-8; MA_Period=48; CCI_Period=24; ATR_Period=48; WPR_Period=24; ATR_Limit=16; MaxCCI=80; BE_value=2; BE_points=60; OppositeSignal_Close=12; TakeProfit=180; StopLoss=500; MagicNumber=777; MaxSpread=100; Slippage=2; OrderComments="Scalperinho"; | ||||
| Bars in test | 244569 | Ticks modelled | 230310434 | Modelling quality | 99.90% |
| Mismatched charts errors | 0 | ||||
| Initial deposit | 10000.00 | Spread | Variable | ||
| Total net profit | 7698.70 | Gross profit | 27380.71 | Gross loss | -19682.01 |
| Profit factor | 1.39 | Expected payoff | 4.79 | ||
| Absolute drawdown | 269.73 | Maximal drawdown | 886.74 (5.29%) | Relative drawdown | 5.29% (886.74) |
| Total trades | 1606 | Short positions (won %) | 847 (70.60%) | Long positions (won %) | 759 (65.88%) |
| Profit trades (% of total) | 1098 (68.37%) | Loss trades (% of total) | 508 (31.63%) | ||
| Largest | profit trade | 117.89 | loss trade | -323.13 | |
| Average | profit trade | 24.94 | loss trade | -38.74 | |
| Maximum | consecutive wins (profit in money) | 17 (355.86) | consecutive losses (loss in money) | 7 (-178.71) | |
| Maximal | consecutive profit (count of wins) | 395.23 (10) | consecutive loss (count of losses) | -639.09 (3) | |
| Average | consecutive wins | 3 | consecutive losses | 1 | |

| Symbol | EURUSD (Euro vs US Dollar) | ||||
| Period | 15 Minutes (M15) 2010.01.04 03:00 - 2019.10.18 11:00 (2010.01.01 - 2019.10.23) | ||||
| Model | Every tick (the most precise method based on all available least timeframes) | ||||
| Parameters | MM="Money Management"; Fixed_Lot=0.1; Reinvestment_Risk=0; TPar="Trading Parameters"; TrendFilter1=5; TrendFilter2=20; TrendFilter3=10; OscillatorFilter1=9; OscillatorFilter2=6; WPR_Close=0; MA_Period=36; CCI_Period=120; ATR_Period=24; WPR_Period=42; ATR_Limit=6; MaxCCI=320; BE_value=4; BE_points=20; OppositeSignal_Close=3; TakeProfit=68; StopLoss=330; MagicNumber=777; MaxSpread=100; Slippage=2; OrderComments="Scalperinho"; | ||||
| Bars in test | 244634 | Ticks modelled | 189256911 | Modelling quality | 99.90% |
| Mismatched charts errors | 0 | ||||
| Initial deposit | 10000.00 | Spread | Variable | ||
| Total net profit | 5986.48 | Gross profit | 5986.94 | Gross loss | -0.46 |
| Profit factor | 13015.09 | Expected payoff | 20.36 | ||
| Absolute drawdown | 51.27 | Maximal drawdown | 284.70 (2.22%) | Relative drawdown | 2.33% (267.96) |
| Total trades | 294 | Short positions (won %) | 158 (100.00%) | Long positions (won %) | 136 (99.26%) |
| Profit trades (% of total) | 293 (99.66%) | Loss trades (% of total) | 1 (0.34%) | ||
| Largest | profit trade | 86.41 | loss trade | -0.46 | |
| Average | profit trade | 20.43 | loss trade | -0.46 | |
| Maximum | consecutive wins (profit in money) | 159 (3163.43) | consecutive losses (loss in money) | 1 (-0.46) | |
| Maximal | consecutive profit (count of wins) | 3163.43 (159) | consecutive loss (count of losses) | -0.46 (1) | |
| Average | consecutive wins | 147 | consecutive losses | 1 | |

| Symbol | GBPAUD (Great Britain Pound vs Australian Dollar) | ||||
| Period | 15 Minutes (M15) 2010.01.04 03:00 - 2019.10.18 11:45 (2010.01.01 - 2019.10.23) | ||||
| Model | Every tick (the most precise method based on all available least timeframes) | ||||
| Parameters | MM="Money Management"; Fixed_Lot=0.1; Reinvestment_Risk=0; TPar="Trading Parameters"; TrendFilter1=10; TrendFilter2=30; TrendFilter3=40; OscillatorFilter1=9; OscillatorFilter2=7; WPR_Close=-2; MA_Period=120; CCI_Period=24; ATR_Period=36; WPR_Period=30; ATR_Limit=10; MaxCCI=180; BE_value=2; BE_points=60; OppositeSignal_Close=4; TakeProfit=220; StopLoss=440; MagicNumber=777; MaxSpread=100; Slippage=2; OrderComments="Scalperinho"; | ||||
| Bars in test | 244570 | Ticks modelled | 255709559 | Modelling quality | 99.90% |
| Mismatched charts errors | 0 | ||||
| Initial deposit | 10000.00 | Spread | Variable | ||
| Total net profit | 19273.56 | Gross profit | 36164.25 | Gross loss | -16890.69 |
| Profit factor | 2.14 | Expected payoff | 13.42 | ||
| Absolute drawdown | 318.34 | Maximal drawdown | 1174.48 (4.24%) | Relative drawdown | 6.55% (756.56) |
| Total trades | 1436 | Short positions (won %) | 685 (76.35%) | Long positions (won %) | 751 (77.10%) |
| Profit trades (% of total) | 1102 (76.74%) | Loss trades (% of total) | 334 (23.26%) | ||
| Largest | profit trade | 200.97 | loss trade | -313.77 | |
| Average | profit trade | 32.82 | loss trade | -50.57 | |
| Maximum | consecutive wins (profit in money) | 20 (870.28) | consecutive losses (loss in money) | 7 (-80.10) | |
| Maximal | consecutive profit (count of wins) | 870.28 (20) | consecutive loss (count of losses) | -626.40 (3) | |
| Average | consecutive wins | 4 | consecutive losses | 1 | |

| Symbol | GBPCAD (Great Britain Pound vs Canadian Dollar) | ||||
| Period | 15 Minutes (M15) 2010.01.04 03:00 - 2019.10.18 11:45 (2010.01.01 - 2019.10.23) | ||||
| Model | Every tick (the most precise method based on all available least timeframes) | ||||
| Parameters | MM="Money Management"; Fixed_Lot=0.1; Reinvestment_Risk=0; TPar="Trading Parameters"; TrendFilter1=7; TrendFilter2=15; TrendFilter3=40; OscillatorFilter1=9; OscillatorFilter2=8; WPR_Close=-6; MA_Period=24; CCI_Period=24; ATR_Period=36; WPR_Period=24; ATR_Limit=14; MaxCCI=70; BE_value=10; BE_points=30; OppositeSignal_Close=4; TakeProfit=90; StopLoss=400; MagicNumber=777; MaxSpread=100; Slippage=2; OrderComments="Scalperinho"; | ||||
| Bars in test | 244322 | Ticks modelled | 238738668 | Modelling quality | 99.90% |
| Mismatched charts errors | 0 | ||||
| Initial deposit | 10000.00 | Spread | Variable | ||
| Total net profit | 4156.82 | Gross profit | 5793.84 | Gross loss | -1637.02 |
| Profit factor | 3.54 | Expected payoff | 10.21 | ||
| Absolute drawdown | 64.23 | Maximal drawdown | 320.63 (2.91%) | Relative drawdown | 2.91% (320.63) |
| Total trades | 407 | Short positions (won %) | 180 (72.78%) | Long positions (won %) | 227 (72.25%) |
| Profit trades (% of total) | 295 (72.48%) | Loss trades (% of total) | 112 (27.52%) | ||
| Largest | profit trade | 179.43 | loss trade | -30.95 | |
| Average | profit trade | 19.64 | loss trade | -14.62 | |
| Maximum | consecutive wins (profit in money) | 15 (336.84) | consecutive losses (loss in money) | 3 (-78.24) | |
| Maximal | consecutive profit (count of wins) | 380.02 (7) | consecutive loss (count of losses) | -78.24 (3) | |
| Average | consecutive wins | 3 | consecutive losses | 1 | |

| Symbol | GBPCHF (Great Britain Pound vs Swiss Franc) | ||||
| Period | 15 Minutes (M15) 2010.01.01 02:00 - 2019.10.18 13:45 (2010.01.01 - 2019.10.23) | ||||
| Model | Every tick (the most precise method based on all available least timeframes) | ||||
| Parameters | MM="Money Management"; Fixed_Lot=0.1; Reinvestment_Risk=0; TPar="Trading Parameters"; TrendFilter1=35; TrendFilter2=10; TrendFilter3=40; OscillatorFilter1=9; OscillatorFilter2=8; WPR_Close=-1; MA_Period=60; CCI_Period=108; ATR_Period=24; WPR_Period=24; ATR_Limit=9; MaxCCI=240; BE_value=5; BE_points=40; OppositeSignal_Close=11; TakeProfit=90; StopLoss=260; MagicNumber=777; MaxSpread=100; Slippage=2; OrderComments="Scalperinho"; | ||||
| Bars in test | 244685 | Ticks modelled | 218996670 | Modelling quality | 99.90% |
| Mismatched charts errors | 0 | ||||
| Initial deposit | 10000.00 | Spread | Variable | ||
| Total net profit | 14008.92 | Gross profit | 31038.20 | Gross loss | -17029.28 |
| Profit factor | 1.82 | Expected payoff | 14.18 | ||
| Absolute drawdown | 75.44 | Maximal drawdown | 737.55 (4.02%) | Relative drawdown | 5.01% (639.74) |
| Total trades | 988 | Short positions (won %) | 546 (74.18%) | Long positions (won %) | 442 (74.66%) |
| Profit trades (% of total) | 735 (74.39%) | Loss trades (% of total) | 253 (25.61%) | ||
| Largest | profit trade | 105.23 | loss trade | -266.53 | |
| Average | profit trade | 42.23 | loss trade | -67.31 | |
| Maximum | consecutive wins (profit in money) | 19 (860.87) | consecutive losses (loss in money) | 5 (-232.71) | |
| Maximal | consecutive profit (count of wins) | 860.87 (19) | consecutive loss (count of losses) | -527.17 (2) | |
| Average | consecutive wins | 4 | consecutive losses | 1 | |

| Symbol | GBPJPY (British Pound vs Japanese Yen) | ||||
| Period | 15 Minutes (M15) 2010.01.04 03:00 - 2019.10.18 14:45 (2010.01.01 - 2019.10.23) | ||||
| Model | Every tick (the most precise method based on all available least timeframes) | ||||
| Parameters | MM="Money Management"; Fixed_Lot=0.1; Reinvestment_Risk=0; TPar="Trading Parameters"; TrendFilter1=5; TrendFilter2=50; TrendFilter3=40; OscillatorFilter1=9; OscillatorFilter2=8; WPR_Close=-8; MA_Period=96; CCI_Period=24; ATR_Period=24; WPR_Period=24; ATR_Limit=12; MaxCCI=70; BE_value=8; BE_points=40; OppositeSignal_Close=2; TakeProfit=110; StopLoss=380; MagicNumber=777; MaxSpread=100; Slippage=2; OrderComments="Scalperinho"; | ||||
| Bars in test | 244609 | Ticks modelled | 247381250 | Modelling quality | 99.90% |
| Mismatched charts errors | 0 | ||||
| Initial deposit | 10000.00 | Spread | Variable | ||
| Total net profit | 20909.43 | Gross profit | 34202.07 | Gross loss | -13292.64 |
| Profit factor | 2.57 | Expected payoff | 14.60 | ||
| Absolute drawdown | 146.77 | Maximal drawdown | 847.28 (4.94%) | Relative drawdown | 4.94% (847.28) |
| Total trades | 1432 | Short positions (won %) | 779 (77.54%) | Long positions (won %) | 653 (72.13%) |
| Profit trades (% of total) | 1075 (75.07%) | Loss trades (% of total) | 357 (24.93%) | ||
| Largest | profit trade | 147.08 | loss trade | -365.87 | |
| Average | profit trade | 31.82 | loss trade | -37.23 | |
| Maximum | consecutive wins (profit in money) | 18 (939.94) | consecutive losses (loss in money) | 4 (-393.10) | |
| Maximal | consecutive profit (count of wins) | 939.94 (18) | consecutive loss (count of losses) | -393.10 (4) | |
| Average | consecutive wins | 4 | consecutive losses | 1 | |

| Symbol | GBPNZD (Great Britan Pound vs New Zealand Dollar) | ||||
| Period | 15 Minutes (M15) 2010.01.04 03:00 - 2019.10.18 14:45 (2010.01.01 - 2019.10.23) | ||||
| Model | Every tick (the most precise method based on all available least timeframes) | ||||
| Parameters | MM="Money Management"; Fixed_Lot=0.1; Reinvestment_Risk=0; TPar="Trading Parameters"; TrendFilter1=2; TrendFilter2=35; TrendFilter3=40; OscillatorFilter1=9; OscillatorFilter2=9; WPR_Close=-4; MA_Period=36; CCI_Period=24; ATR_Period=48; WPR_Period=30; ATR_Limit=14; MaxCCI=90; BE_value=6; BE_points=200; OppositeSignal_Close=8; TakeProfit=280; StopLoss=360; MagicNumber=777; MaxSpread=100; Slippage=2; OrderComments="Scalperinho"; | ||||
| Bars in test | 244027 | Ticks modelled | 227292223 | Modelling quality | 99.90% |
| Mismatched charts errors | 0 | ||||
| Initial deposit | 10000.00 | Spread | Variable | ||
| Total net profit | 9893.02 | Gross profit | 18911.92 | Gross loss | -9018.90 |
| Profit factor | 2.10 | Expected payoff | 12.95 | ||
| Absolute drawdown | 90.92 | Maximal drawdown | 701.23 (6.35%) | Relative drawdown | 6.35% (701.23) |
| Total trades | 764 | Short positions (won %) | 378 (76.19%) | Long positions (won %) | 386 (78.76%) |
| Profit trades (% of total) | 592 (77.49%) | Loss trades (% of total) | 172 (22.51%) | ||
| Largest | profit trade | 177.62 | loss trade | -279.66 | |
| Average | profit trade | 31.95 | loss trade | -52.44 | |
| Maximum | consecutive wins (profit in money) | 16 (543.83) | consecutive losses (loss in money) | 5 (-310.60) | |
| Maximal | consecutive profit (count of wins) | 634.72 (15) | consecutive loss (count of losses) | -476.89 (3) | |
| Average | consecutive wins | 4 | consecutive losses | 1 | |

| Symbol | GBPUSD (Great Britan Pound vs US Dollar) | ||||
| Period | 15 Minutes (M15) 2010.01.01 02:00 - 2019.10.18 21:00 (2010.01.01 - 2019.10.23) | ||||
| Model | Every tick (the most precise method based on all available least timeframes) | ||||
| Parameters | MM="Money Management"; Fixed_Lot=0.1; Reinvestment_Risk=0; TPar="Trading Parameters"; TrendFilter1=6; TrendFilter2=45; TrendFilter3=40; OscillatorFilter1=9; OscillatorFilter2=8; WPR_Close=-4; MA_Period=48; CCI_Period=24; ATR_Period=24; WPR_Period=36; ATR_Limit=6; MaxCCI=120; BE_value=10; BE_points=60; OppositeSignal_Close=2; TakeProfit=240; StopLoss=460; MagicNumber=777; MaxSpread=100; Slippage=2; OrderComments="Scalperinho"; | ||||
| Bars in test | 244708 | Ticks modelled | 187695275 | Modelling quality | 99.90% |
| Mismatched charts errors | 0 | ||||
| Initial deposit | 10000.00 | Spread | Variable | ||
| Total net profit | 9911.61 | Gross profit | 11802.72 | Gross loss | -1891.11 |
| Profit factor | 6.24 | Expected payoff | 24.06 | ||
| Absolute drawdown | 787.03 | Maximal drawdown | 835.90 (8.32%) | Relative drawdown | 8.32% (835.90) |
| Total trades | 412 | Short positions (won %) | 209 (81.82%) | Long positions (won %) | 203 (75.86%) |
| Profit trades (% of total) | 325 (78.88%) | Loss trades (% of total) | 87 (21.12%) | ||
| Largest | profit trade | 166.50 | loss trade | -460.82 | |
| Average | profit trade | 36.32 | loss trade | -21.74 | |
| Maximum | consecutive wins (profit in money) | 30 (1303.64) | consecutive losses (loss in money) | 4 (-52.59) | |
| Maximal | consecutive profit (count of wins) | 1303.64 (30) | consecutive loss (count of losses) | -460.82 (1) | |
| Average | consecutive wins | 4 | consecutive losses | 1 | |

| Symbol | NZDCAD (Canadian Dollar vs Canadian Dollar) | ||||
| Period | 15 Minutes (M15) 2010.01.04 03:00 - 2019.10.18 22:15 (2010.01.01 - 2019.10.23) | ||||
| Model | Every tick (the most precise method based on all available least timeframes) | ||||
| Parameters | MM="Money Management"; Fixed_Lot=0.1; Reinvestment_Risk=0; TPar="Trading Parameters"; TrendFilter1=10; TrendFilter2=5; TrendFilter3=40; OscillatorFilter1=9; OscillatorFilter2=7; WPR_Close=-8; MA_Period=120; CCI_Period=24; ATR_Period=36; WPR_Period=18; ATR_Limit=12; MaxCCI=60; BE_value=2; BE_points=40; OppositeSignal_Close=2; TakeProfit=30; StopLoss=280; MagicNumber=777; MaxSpread=100; Slippage=2; OrderComments="Scalperinho"; | ||||
| Bars in test | 244525 | Ticks modelled | 144887292 | Modelling quality | 99.90% |
| Mismatched charts errors | 0 | ||||
| Initial deposit | 10000.00 | Spread | Variable | ||
| Total net profit | 2819.23 | Gross profit | 4557.12 | Gross loss | -1737.89 |
| Profit factor | 2.62 | Expected payoff | 5.75 | ||
| Absolute drawdown | 63.48 | Maximal drawdown | 292.99 (2.42%) | Relative drawdown | 2.42% (292.99) |
| Total trades | 490 | Short positions (won %) | 263 (69.20%) | Long positions (won %) | 227 (62.56%) |
| Profit trades (% of total) | 324 (66.12%) | Loss trades (% of total) | 166 (33.88%) | ||
| Largest | profit trade | 69.48 | loss trade | -215.75 | |
| Average | profit trade | 14.07 | loss trade | -10.47 | |
| Maximum | consecutive wins (profit in money) | 17 (255.62) | consecutive losses (loss in money) | 6 (-42.88) | |
| Maximal | consecutive profit (count of wins) | 255.62 (17) | consecutive loss (count of losses) | -215.75 (1) | |
| Average | consecutive wins | 3 | consecutive losses | 1 | |

| Symbol | NZDCHF (New Zealand Dollar vs Swiss Franc) | ||||
| Period | 15 Minutes (M15) 2010.01.04 03:00 - 2019.10.18 22:15 (2010.01.01 - 2019.10.23) | ||||
| Model | Every tick (the most precise method based on all available least timeframes) | ||||
| Parameters | MM="Money Management"; Fixed_Lot=0.1; Reinvestment_Risk=0; TPar="Trading Parameters"; TrendFilter1=0; TrendFilter2=40; TrendFilter3=40; OscillatorFilter1=9; OscillatorFilter2=7; WPR_Close=-2; MA_Period=24; CCI_Period=24; ATR_Period=24; WPR_Period=18; ATR_Limit=6; MaxCCI=20; BE_value=6; BE_points=40; OppositeSignal_Close=6; TakeProfit=50; StopLoss=360; MagicNumber=777; MaxSpread=100; Slippage=2; OrderComments="Scalperinho"; | ||||
| Bars in test | 244279 | Ticks modelled | 149778579 | Modelling quality | 99.90% |
| Mismatched charts errors | 0 | ||||
| Initial deposit | 10000.00 | Spread | Variable | ||
| Total net profit | 4326.09 | Gross profit | 10984.00 | Gross loss | -6657.91 |
| Profit factor | 1.65 | Expected payoff | 6.66 | ||
| Absolute drawdown | 81.87 | Maximal drawdown | 601.33 (5.22%) | Relative drawdown | 5.22% (601.33) |
| Total trades | 650 | Short positions (won %) | 346 (63.87%) | Long positions (won %) | 304 (69.08%) |
| Profit trades (% of total) | 431 (66.31%) | Loss trades (% of total) | 219 (33.69%) | ||
| Largest | profit trade | 53.38 | loss trade | -365.73 | |
| Average | profit trade | 25.48 | loss trade | -30.40 | |
| Maximum | consecutive wins (profit in money) | 13 (414.42) | consecutive losses (loss in money) | 7 (-151.69) | |
| Maximal | consecutive profit (count of wins) | 414.42 (13) | consecutive loss (count of losses) | -409.00 (2) | |
| Average | consecutive wins | 3 | consecutive losses | 2 | |

| Symbol | NZDJPY (New Zealand vs Japanise Yen) | ||||
| Period | 15 Minutes (M15) 2010.01.01 02:00 - 2019.10.18 22:15 (2010.01.01 - 2019.10.23) | ||||
| Model | Every tick (the most precise method based on all available least timeframes) | ||||
| Parameters | MM="Money Management"; Fixed_Lot=0.1; Reinvestment_Risk=0; TPar="Trading Parameters"; TrendFilter1=0; TrendFilter2=30; TrendFilter3=40; OscillatorFilter1=9; OscillatorFilter2=9; WPR_Close=-2; MA_Period=36; CCI_Period=24; ATR_Period=36; WPR_Period=24; ATR_Limit=8; MaxCCI=160; BE_value=2; BE_points=30; OppositeSignal_Close=6; TakeProfit=220; StopLoss=440; MagicNumber=777; MaxSpread=100; Slippage=2; OrderComments="Scalperinho"; | ||||
| Bars in test | 244452 | Ticks modelled | 164205818 | Modelling quality | 99.90% |
| Mismatched charts errors | 0 | ||||
| Initial deposit | 10000.00 | Spread | Variable | ||
| Total net profit | 5409.08 | Gross profit | 10591.91 | Gross loss | -5182.83 |
| Profit factor | 2.04 | Expected payoff | 10.17 | ||
| Absolute drawdown | 126.41 | Maximal drawdown | 535.37 (3.87%) | Relative drawdown | 3.87% (535.37) |
| Total trades | 532 | Short positions (won %) | 290 (71.03%) | Long positions (won %) | 242 (70.66%) |
| Profit trades (% of total) | 377 (70.86%) | Loss trades (% of total) | 155 (29.14%) | ||
| Largest | profit trade | 98.13 | loss trade | -458.25 | |
| Average | profit trade | 28.10 | loss trade | -33.44 | |
| Maximum | consecutive wins (profit in money) | 11 (207.09) | consecutive losses (loss in money) | 4 (-54.38) | |
| Maximal | consecutive profit (count of wins) | 318.37 (10) | consecutive loss (count of losses) | -458.25 (1) | |
| Average | consecutive wins | 3 | consecutive losses | 1 | |

| Symbol | NZDUSD (New Zealand Dollar vs US Dollar) | ||||
| Period | 15 Minutes (M15) 2010.01.04 03:00 - 2019.10.18 22:45 (2010.01.01 - 2019.10.23) | ||||
| Model | Every tick (the most precise method based on all available least timeframes) | ||||
| Parameters | MM="Money Management"; Fixed_Lot=0.1; Reinvestment_Risk=0; TPar="Trading Parameters"; TrendFilter1=10; TrendFilter2=40; TrendFilter3=10; OscillatorFilter1=7; OscillatorFilter2=6; WPR_Close=0; MA_Period=72; CCI_Period=84; ATR_Period=12; WPR_Period=54; ATR_Limit=8; MaxCCI=320; BE_value=1; BE_points=35; OppositeSignal_Close=3; TakeProfit=35; StopLoss=340; MagicNumber=777; MaxSpread=100; Slippage=2; OrderComments="Scalperinho"; | ||||
| Bars in test | 244551 | Ticks modelled | 116043387 | Modelling quality | 99.90% |
| Mismatched charts errors | 0 | ||||
| Initial deposit | 10000.00 | Spread | Variable | ||
| Total net profit | 7942.36 | Gross profit | 8624.03 | Gross loss | -681.67 |
| Profit factor | 12.65 | Expected payoff | 16.55 | ||
| Absolute drawdown | 23.48 | Maximal drawdown | 600.72 (4.77%) | Relative drawdown | 4.77% (600.72) |
| Total trades | 480 | Short positions (won %) | 261 (99.23%) | Long positions (won %) | 219 (100.00%) |
| Profit trades (% of total) | 478 (99.58%) | Loss trades (% of total) | 2 (0.42%) | ||
| Largest | profit trade | 38.01 | loss trade | -340.87 | |
| Average | profit trade | 18.04 | loss trade | -340.83 | |
| Maximum | consecutive wins (profit in money) | 206 (3878.34) | consecutive losses (loss in money) | 1 (-340.87) | |
| Maximal | consecutive profit (count of wins) | 3878.34 (206) | consecutive loss (count of losses) | -340.87 (1) | |
| Average | consecutive wins | 159 | consecutive losses | 1 | |

| Symbol | USDCAD (US Dollar vs Canadian Dollar) | ||||
| Period | 15 Minutes (M15) 2010.01.04 03:00 - 2019.10.18 23:15 (2010.01.01 - 2019.10.23) | ||||
| Model | Every tick (the most precise method based on all available least timeframes) | ||||
| Parameters | MM="Money Management"; Fixed_Lot=0.1; Reinvestment_Risk=0; TPar="Trading Parameters"; TrendFilter1=15; TrendFilter2=10; TrendFilter3=20; OscillatorFilter1=10; OscillatorFilter2=9; WPR_Close=-8; MA_Period=108; CCI_Period=96; ATR_Period=48; WPR_Period=54; ATR_Limit=6; MaxCCI=120; BE_value=4; BE_points=50; OppositeSignal_Close=6; TakeProfit=58; StopLoss=260; MagicNumber=777; MaxSpread=100; Slippage=2; OrderComments="Scalperinho"; | ||||
| Bars in test | 244595 | Ticks modelled | 139342369 | Modelling quality | 99.90% |
| Mismatched charts errors | 0 | ||||
| Initial deposit | 10000.00 | Spread | Variable | ||
| Total net profit | 5441.31 | Gross profit | 8718.07 | Gross loss | -3276.76 |
| Profit factor | 2.66 | Expected payoff | 9.98 | ||
| Absolute drawdown | 161.74 | Maximal drawdown | 287.60 (1.88%) | Relative drawdown | 2.55% (276.67) |
| Total trades | 545 | Short positions (won %) | 254 (74.80%) | Long positions (won %) | 291 (79.38%) |
| Profit trades (% of total) | 421 (77.25%) | Loss trades (% of total) | 124 (22.75%) | ||
| Largest | profit trade | 59.16 | loss trade | -252.58 | |
| Average | profit trade | 20.71 | loss trade | -26.43 | |
| Maximum | consecutive wins (profit in money) | 17 (353.73) | consecutive losses (loss in money) | 7 (-69.06) | |
| Maximal | consecutive profit (count of wins) | 453.49 (16) | consecutive loss (count of losses) | -252.58 (1) | |
| Average | consecutive wins | 4 | consecutive losses | 1 | |

| Symbol | USDCHF (US Dollar vs Swiss Franc) | ||||
| Period | 15 Minutes (M15) 2010.01.04 03:00 - 2019.10.18 23:15 (2010.01.01 - 2019.10.23) | ||||
| Model | Every tick (the most precise method based on all available least timeframes) | ||||
| Parameters | MM="Money Management"; Fixed_Lot=0.1; Reinvestment_Risk=0; TPar="Trading Parameters"; TrendFilter1=30; TrendFilter2=10; TrendFilter3=35; OscillatorFilter1=10; OscillatorFilter2=1; WPR_Close=-1; MA_Period=36; CCI_Period=84; ATR_Period=24; WPR_Period=66; ATR_Limit=9; MaxCCI=360; BE_value=6; BE_points=40; OppositeSignal_Close=5; TakeProfit=46; StopLoss=250; MagicNumber=777; MaxSpread=100; Slippage=2; OrderComments="Scalperinho"; | ||||
| Bars in test | 244628 | Ticks modelled | 124688761 | Modelling quality | 99.90% |
| Mismatched charts errors | 0 | ||||
| Initial deposit | 10000.00 | Spread | Variable | ||
| Total net profit | 17018.30 | Gross profit | 33571.23 | Gross loss | -16552.93 |
| Profit factor | 2.03 | Expected payoff | 14.04 | ||
| Absolute drawdown | 241.27 | Maximal drawdown | 823.05 (4.00%) | Relative drawdown | 5.36% (652.58) |
| Total trades | 1212 | Short positions (won %) | 636 (82.08%) | Long positions (won %) | 576 (83.16%) |
| Profit trades (% of total) | 1001 (82.59%) | Loss trades (% of total) | 211 (17.41%) | ||
| Largest | profit trade | 65.78 | loss trade | -313.45 | |
| Average | profit trade | 33.54 | loss trade | -78.45 | |
| Maximum | consecutive wins (profit in money) | 30 (864.02) | consecutive losses (loss in money) | 4 (-276.99) | |
| Maximal | consecutive profit (count of wins) | 1639.52 (29) | consecutive loss (count of losses) | -587.83 (3) | |
| Average | consecutive wins | 6 | consecutive losses | 1 | |

| Symbol | USDJPY (US Dollar vs Japanese Yen) | ||||
| Period | 15 Minutes (M15) 2010.01.05 01:00 - 2019.10.18 23:45 (2010.01.01 - 2019.10.23) | ||||
| Model | Every tick (the most precise method based on all available least timeframes) | ||||
| Parameters | MM="Money Management"; Fixed_Lot=0.1; Reinvestment_Risk=0; TPar="Trading Parameters"; TrendFilter1=35; TrendFilter2=60; TrendFilter3=35; OscillatorFilter1=9; OscillatorFilter2=9; WPR_Close=-12; MA_Period=120; CCI_Period=84; ATR_Period=48; WPR_Period=12; ATR_Limit=9; MaxCCI=180; BE_value=5; BE_points=50; OppositeSignal_Close=5; TakeProfit=32; StopLoss=170; MagicNumber=777; MaxSpread=100; Slippage=2; OrderComments="Scalperinho"; | ||||
| Bars in test | 244408 | Ticks modelled | 146606236 | Modelling quality | 99.90% |
| Mismatched charts errors | 0 | ||||
| Initial deposit | 10000.00 | Spread | Variable | ||
| Total net profit | 4046.93 | Gross profit | 8615.81 | Gross loss | -4568.88 |
| Profit factor | 1.89 | Expected payoff | 5.91 | ||
| Absolute drawdown | 80.23 | Maximal drawdown | 342.96 (3.20%) | Relative drawdown | 3.20% (342.96) |
| Total trades | 685 | Short positions (won %) | 451 (67.63%) | Long positions (won %) | 234 (69.66%) |
| Profit trades (% of total) | 468 (68.32%) | Loss trades (% of total) | 217 (31.68%) | ||
| Largest | profit trade | 40.76 | loss trade | -213.68 | |
| Average | profit trade | 18.41 | loss trade | -21.05 | |
| Maximum | consecutive wins (profit in money) | 9 (153.23) | consecutive losses (loss in money) | 8 (-243.40) | |
| Maximal | consecutive profit (count of wins) | 202.85 (8) | consecutive loss (count of losses) | -247.28 (3) | |
| Average | consecutive wins | 3 | consecutive losses | 1 | |


All EA reviews (15)
Latest EA reviews
AutoGenEA
An EA that is developed by Generic Machine Learning. Check it out
Momentum EA BOA
A momentum / trend following strategy with good and stable backtests.
Scalperinho EA
A very promissing EA that trades intraday pullbacks on a impressive number of 28 pairs.
StarX
A cheap night scalper with promising backtests. Check it out.
Inertia EA Extra
A S/R scalper for the EURUSD pair with an impressive backtest.
SFE Night Scalper
An asian scalper with a 4 years old live account. Check out our review
Aura MT4
A trend follwing system with inconsistent backtests.
SFE Stealth
Promising new Asian scalper with good live results. Check out our review.
FXStabilizer PRO
A martingale system which survived astonishing long in live trading
Mito EA
A trend / counter trend system that trades 31 different pairs. Check it out
FXAdept
A successful trend following EA with nearly two years of live history. Check out our review.
Bazava
A quite cheap intraday scalper for the NZDUSD. Is it worth the money? Check it out.
Tesseract
A counter-trend system with inconsistent backtests
Legend
A combination of a momentum based strategy and an SR level breakout system
CEF Phantom Scalper
An aggressive intraday counter-trend scalper on M1 time frame
Want to start trading on a live or demo account?
Be aware that most retail traders (usually around 60-80%) lose money. Please consider whether you can afford to take the risk of losing your money.


