EA review - Candelabrum EA
| Rating total: | |
| Backtests: | |
| Live performance: | |
| Risk control: | |
| Customizability: | |
| Price: |
| Vendor link | Price: | $95 (2022.10.25) |
| Trading strategy: | Counter-Trend, Candlestick patterns |
| Vendor live account: | No |
| Own live account: | No |
| Latest tested version: | 2.0 |
| Latest tested date: | 2019.09.06 |
| Risk factors: | Zig zag movement |
Candelabrum EA uses candlestick patterns, pivot points and Bollinger bands as indicators to detect the start of a new trend. Pin bar patterns are often used for entries because they are usually interpreted as a sign for a reversal. Therefore, we classify the system as a counter-trend strategy. After entering the initial position it will often partially close the position at different percentage Fibonacci levels to diversify the exit.
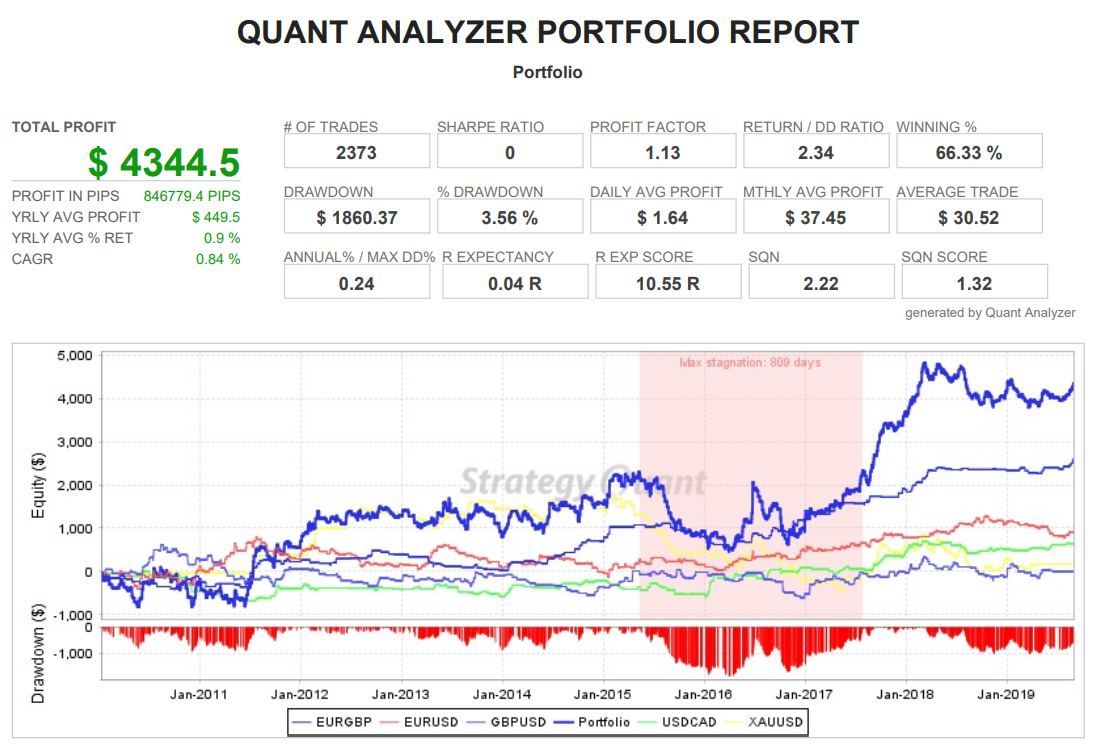
The backtests on real spread data do not look very convincing, except for EURGBP. However, on EURUSD and USDCAD the performance in recent years was better than the performance in earlier years, which might also partly explain the better live performance compared to backtests.
Our opinion
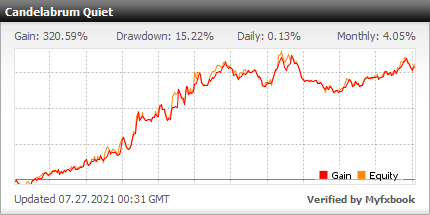
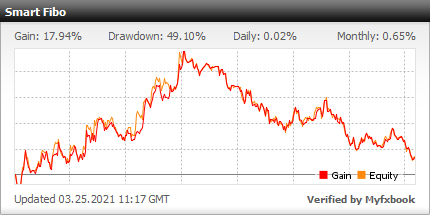
This EA is again one of the few exceptions where the live signal is better than one would assume from historic backtests. Considering the low price, it could be worth testing on live accounts if you are searching for an EA based on candlestick patterns.Live performance
Fixed lot size backtests
Why do we use fixed lot size (0.1 lots)? Check our educational page.
Dukascopy 2019.09.06, version 2.0| Symbol | EURUSD (Euro vs US Dollar) | ||||
| Period | 4 Hours (H4) 2010.01.01 00:00 - 2019.08.30 08:00 (2010.01.01 - 2019.08.31) | ||||
| Model | Every tick (the most precise method based on all available least timeframes) | ||||
| Parameters | MagicID=445876; Comm="CAN_EUR"; TF=240; HS=0; HE=24; FHE=20; MaxSpread=50; MaxLot=100; MinRange=0; LotType=0; MainLot=0.1; FactorRisk=1; FactorAuto=500; BPeriod=30; BDev=2; Model1=false; Model2=true; Takeprofit=700; Stoploss=30; Trailing=true; TrailStart=400; TrailStop=300; Split=true; SplitStart=300; SplitStep=50; SplitLot=50; SplitLotLastMin=0; ShowFibo=true; FiboUpColor=Gray; FiboDnColor=Gray; | ||||
| Bars in test | 17076 | Ticks modelled | 228354381 | Modelling quality | 99.90% |
| Mismatched charts errors | 0 | ||||
| Initial deposit | 10000.00 | Spread | Variable | ||
| Total net profit | 926.33 | Gross profit | 9099.28 | Gross loss | -8172.95 |
| Profit factor | 1.11 | Expected payoff | 1.38 | ||
| Absolute drawdown | 509.17 | Maximal drawdown | 976.48 (9.00%) | Relative drawdown | 9.00% (976.48) |
| Total trades | 669 | Short positions (won %) | 350 (65.43%) | Long positions (won %) | 319 (63.32%) |
| Profit trades (% of total) | 431 (64.42%) | Loss trades (% of total) | 238 (35.58%) | ||
| Largest | profit trade | 136.31 | loss trade | -160.36 | |
| Average | profit trade | 21.11 | loss trade | -34.34 | |
| Maximum | consecutive wins (profit in money) | 14 (385.36) | consecutive losses (loss in money) | 9 (-340.33) | |
| Maximal | consecutive profit (count of wins) | 385.36 (14) | consecutive loss (count of losses) | -358.22 (5) | |
| Average | consecutive wins | 4 | consecutive losses | 2 | |

| Symbol | GBPUSD (Great Britain Pound vs US Dollar) | ||||
| Period | 4 Hours (H4) 2010.01.01 00:00 - 2019.08.30 08:00 (2010.01.01 - 2019.08.31) | ||||
| Model | Every tick (the most precise method based on all available least timeframes) | ||||
| Parameters | MagicID=445876; Comm="CAN_GBP"; TF=240; HS=0; HE=24; FHE=20; MaxSpread=30; MaxLot=100; MinRange=100; LotType=0; MainLot=0.1; FactorRisk=1; FactorAuto=500; BPeriod=30; BDev=2; Model1=false; Model2=true; Takeprofit=1000; Stoploss=30; Trailing=true; TrailStart=200; TrailStop=200; Split=true; SplitStart=300; SplitStep=100; SplitLot=20; SplitLotLastMin=0; ShowFibo=true; FiboUpColor=Gray; FiboDnColor=Gray; | ||||
| Bars in test | 17074 | Ticks modelled | 224899078 | Modelling quality | 99.90% |
| Mismatched charts errors | 0 | ||||
| Initial deposit | 10000.00 | Spread | Variable | ||
| Total net profit | 0.36 | Gross profit | 7380.19 | Gross loss | -7379.83 |
| Profit factor | 1.00 | Expected payoff | 0.00 | ||
| Absolute drawdown | 623.67 | Maximal drawdown | 1275.89 (11.98%) | Relative drawdown | 11.98% (1275.89) |
| Total trades | 559 | Short positions (won %) | 257 (63.81%) | Long positions (won %) | 302 (69.87%) |
| Profit trades (% of total) | 375 (67.08%) | Loss trades (% of total) | 184 (32.92%) | ||
| Largest | profit trade | 121.69 | loss trade | -173.43 | |
| Average | profit trade | 19.68 | loss trade | -40.11 | |
| Maximum | consecutive wins (profit in money) | 21 (300.78) | consecutive losses (loss in money) | 9 (-255.15) | |
| Maximal | consecutive profit (count of wins) | 431.93 (12) | consecutive loss (count of losses) | -473.15 (7) | |
| Average | consecutive wins | 5 | consecutive losses | 2 | |

| Symbol | EURGBP (Euro vs Great Britain Pound) | ||||
| Period | 4 Hours (H4) 2010.01.01 00:00 - 2019.08.30 08:00 (2010.01.01 - 2019.08.31) | ||||
| Model | Every tick (the most precise method based on all available least timeframes) | ||||
| Parameters | MagicID=445876; Comm="CNDLBRM"; TF=240; HS=0; HE=24; FHE=20; MaxSpread=50; MaxLot=100; MinRange=0; LotType=0; MainLot=0.1; FactorRisk=5; FactorAuto=500; BPeriod=20; BDev=2; Model1=true; Model2=false; Takeprofit=850; Stoploss=20; Trailing=true; TrailStart=300; TrailStop=300; Split=true; SplitStart=400; SplitStep=150; SplitLot=40; SplitLotLastMin=0.01; ShowFibo=true; FiboUpColor=Gray; FiboDnColor=Gray; | ||||
| Bars in test | 17073 | Ticks modelled | 202505680 | Modelling quality | 99.90% |
| Mismatched charts errors | 0 | ||||
| Initial deposit | 10000.00 | Spread | Variable | ||
| Total net profit | 2607.99 | Gross profit | 6499.92 | Gross loss | -3891.93 |
| Profit factor | 1.67 | Expected payoff | 9.31 | ||
| Absolute drawdown | 465.90 | Maximal drawdown | 619.19 (5.54%) | Relative drawdown | 5.54% (619.19) |
| Total trades | 280 | Short positions (won %) | 166 (67.47%) | Long positions (won %) | 114 (53.51%) |
| Profit trades (% of total) | 173 (61.79%) | Loss trades (% of total) | 107 (38.21%) | ||
| Largest | profit trade | 177.12 | loss trade | -96.36 | |
| Average | profit trade | 37.57 | loss trade | -36.37 | |
| Maximum | consecutive wins (profit in money) | 15 (502.39) | consecutive losses (loss in money) | 7 (-358.24) | |
| Maximal | consecutive profit (count of wins) | 502.39 (15) | consecutive loss (count of losses) | -358.24 (7) | |
| Average | consecutive wins | 4 | consecutive losses | 2 | |

| Symbol | USDCAD (US Dollar vs Canadian Dollar) | ||||
| Period | 4 Hours (H4) 2010.01.01 00:00 - 2019.08.30 08:00 (2010.01.01 - 2019.08.31) | ||||
| Model | Every tick (the most precise method based on all available least timeframes) | ||||
| Parameters | MagicID=445876; Comm="CAN_CAD"; TF=240; HS=0; HE=24; FHE=20; MaxSpread=30; MaxLot=100; MinRange=100; LotType=0; MainLot=0.1; FactorRisk=3; FactorAuto=500; BPeriod=20; BDev=2; Model1=true; Model2=false; Takeprofit=1100; Stoploss=10; Trailing=true; TrailStart=300; TrailStop=250; Split=true; SplitStart=300; SplitStep=100; SplitLot=20; SplitLotLastMin=0; ShowFibo=true; FiboUpColor=Gray; FiboDnColor=Gray; | ||||
| Bars in test | 17073 | Ticks modelled | 176661297 | Modelling quality | 99.90% |
| Mismatched charts errors | 0 | ||||
| Initial deposit | 10000.00 | Spread | Variable | ||
| Total net profit | 641.90 | Gross profit | 4814.11 | Gross loss | -4172.21 |
| Profit factor | 1.15 | Expected payoff | 1.56 | ||
| Absolute drawdown | 771.20 | Maximal drawdown | 872.60 (8.64%) | Relative drawdown | 8.64% (872.60) |
| Total trades | 411 | Short positions (won %) | 209 (68.90%) | Long positions (won %) | 202 (74.75%) |
| Profit trades (% of total) | 295 (71.78%) | Loss trades (% of total) | 116 (28.22%) | ||
| Largest | profit trade | 84.49 | loss trade | -97.40 | |
| Average | profit trade | 16.32 | loss trade | -35.97 | |
| Maximum | consecutive wins (profit in money) | 18 (520.21) | consecutive losses (loss in money) | 6 (-198.21) | |
| Maximal | consecutive profit (count of wins) | 520.21 (18) | consecutive loss (count of losses) | -330.18 (4) | |
| Average | consecutive wins | 4 | consecutive losses | 2 | |

| Symbol | XAUUSD (Gold vs US Dollar) | ||||
| Period | 4 Hours (H4) 2010.04.13 08:00 - 2019.04.26 04:00 (2010.01.01 - 2019.08.31) | ||||
| Model | Every tick (the most precise method based on all available least timeframes) | ||||
| Parameters | MagicID=445876; Comm="CAN_XAU"; TF=240; HS=0; HE=24; FHE=20; MaxSpread=30; MaxLot=100; MinRange=0; LotType=0; MainLot=0.1; FactorRisk=3; FactorAuto=500; BPeriod=20; BDev=2; Model1=true; Model2=true; Takeprofit=850; Stoploss=20; Trailing=true; TrailStart=300; TrailStop=300; Split=true; SplitStart=400; SplitStep=50; SplitLot=20; SplitLotLastMin=0; ShowFibo=true; FiboUpColor=Gray; FiboDnColor=Gray; | ||||
| Bars in test | 15988 | Ticks modelled | 257633224 | Modelling quality | 99.90% |
| Mismatched charts errors | 0 | ||||
| Initial deposit | 10000.00 | Spread | Variable | ||
| Total net profit | 167.83 | Gross profit | 10587.07 | Gross loss | -10419.24 |
| Profit factor | 1.02 | Expected payoff | 0.37 | ||
| Absolute drawdown | 507.81 | Maximal drawdown | 2440.52 (20.45%) | Relative drawdown | 20.45% (2440.52) |
| Total trades | 454 | Short positions (won %) | 181 (60.77%) | Long positions (won %) | 273 (69.60%) |
| Profit trades (% of total) | 300 (66.08%) | Loss trades (% of total) | 154 (33.92%) | ||
| Largest | profit trade | 101.78 | loss trade | -219.89 | |
| Average | profit trade | 35.29 | loss trade | -67.66 | |
| Maximum | consecutive wins (profit in money) | 20 (894.86) | consecutive losses (loss in money) | 11 (-559.49) | |
| Maximal | consecutive profit (count of wins) | 894.86 (20) | consecutive loss (count of losses) | -747.84 (10) | |
| Average | consecutive wins | 5 | consecutive losses | 3 | |

All EA reviews (15)
Latest EA reviews
AutoGenEA
An EA that is developed by Generic Machine Learning. Check it out
Momentum EA BOA
A momentum / trend following strategy with good and stable backtests.
Scalperinho EA
A very promissing EA that trades intraday pullbacks on a impressive number of 28 pairs.
StarX
A cheap night scalper with promising backtests. Check it out.
Inertia EA Extra
A S/R scalper for the EURUSD pair with an impressive backtest.
SFE Night Scalper
An asian scalper with a 4 years old live account. Check out our review
Aura MT4
A trend follwing system with inconsistent backtests.
SFE Stealth
Promising new Asian scalper with good live results. Check out our review.
FXStabilizer PRO
A martingale system which survived astonishing long in live trading
Mito EA
A trend / counter trend system that trades 31 different pairs. Check it out
FXAdept
A successful trend following EA with nearly two years of live history. Check out our review.
Bazava
A quite cheap intraday scalper for the NZDUSD. Is it worth the money? Check it out.
Tesseract
A counter-trend system with inconsistent backtests
Legend
A combination of a momentum based strategy and an SR level breakout system
CEF Phantom Scalper
An aggressive intraday counter-trend scalper on M1 time frame
Want to start trading on a live or demo account?
Be aware that most retail traders (usually around 60-80%) lose money. Please consider whether you can afford to take the risk of losing your money.